
A couple charts to explain a Harris loss
Polygraph | Newsletter n°275 | 6 Nov 2024

*Big thanks to Timbuk T., Polygraph’s newest VIP/paid subscriber! Please join here:
Situation
At the time of writing, Kamala Harris looks like she’s toast.
I made several charts in anticipation of a Harris loss, and I definitely wouldn’t have had I not considered her defeat a strong possibility. Remember, here at Polygraph, we make all our graphs by hand — and it’s a real pain in the arse.
Why did I consider her defeat likely? Because Harris ran on an anti-populist economic agenda and an anti-antiwar foreign policy platform, and neither of those things poll well.
I think the former mattered more, though. Specifically, her neglect of cost-of-living issues that I talked about in my last newsletter.
Most people evaluate the economy in terms of how (un)affordable everyday life is, not by looking at macroeconomic variables or the stock market.

Now think about how the White House has talked about the economy for the last 2.5 years. In this way, Biden set up Harris for failure by refusing to even mention the cost-of-living crisis. When he talked about the economy, it’s pretty much always gone like this:
s.")
Harris at least acknowledged people’s economic hardship, but it was too little, too late. Her economic platform was breathtakingly unambitious. And she refused to differentiate herself in any meaningful way from Biden, who people resented for his real or imagined role in causing the cost-of-living crisis, and his near-total refusal to even acknowledge it.
For example, in this video clip, Stephen Colbert asks Harris, "Under a Harris administration, what would the major changes be and what would stay the same?" Harris replies: "Sure. Well, I mean, I'm obviously not Joe Biden. So that would be one change. But also I think it's important to say with 28 days to go, I'm not Donald Trump."
First, that doesn’t answer the question. Second, that description applies to literally everyone except for Joe Biden and Donald Trump. This is the quality of candidate you get when the Democratic Party chooses one for you.
A couple charts to explain a Harris loss
The graph in this newsletter — which discusses the moment in which the Biden-Harris administration pivoted away from the populist economic platform they ran and won on in 2020 — marks the origin of Harris’s insipid and unsuccessful domestic platform of 2024. That’s certainly relevant. But I decided on these two (new) charts.
In September, two US government reports came out. First was the report on hunger from the Department of Agriculture; second was the Census Bureau report on poverty.
The findings are 1) expressed in the graphs below, and 2) not good. Despite 2), Harris didn’t pivot toward addressing poverty or hunger more aggressively. In fact, her platform became less poor- and working class-oriented in the weeks leading up to the election (and more Wall Street-oriented). This is on Harris.
NB: The figures below refers to the increase in the number of people living below the poverty line and living in food-insecure households, not the increase in poverty and food insecurity rates. Those rates increased 65% and 38% respectively since 2021.1
NB(2): The figures on poverty refer to the Supplemental Poverty Measure (SPM), not the Official Poverty Measure (OPM). SPM is a better way to measure poverty. Read more here: https://www.census.gov/newsroom/blogs/random-samplings/2021/09/difference-between-supplemental-and-official-poverty-measures.html
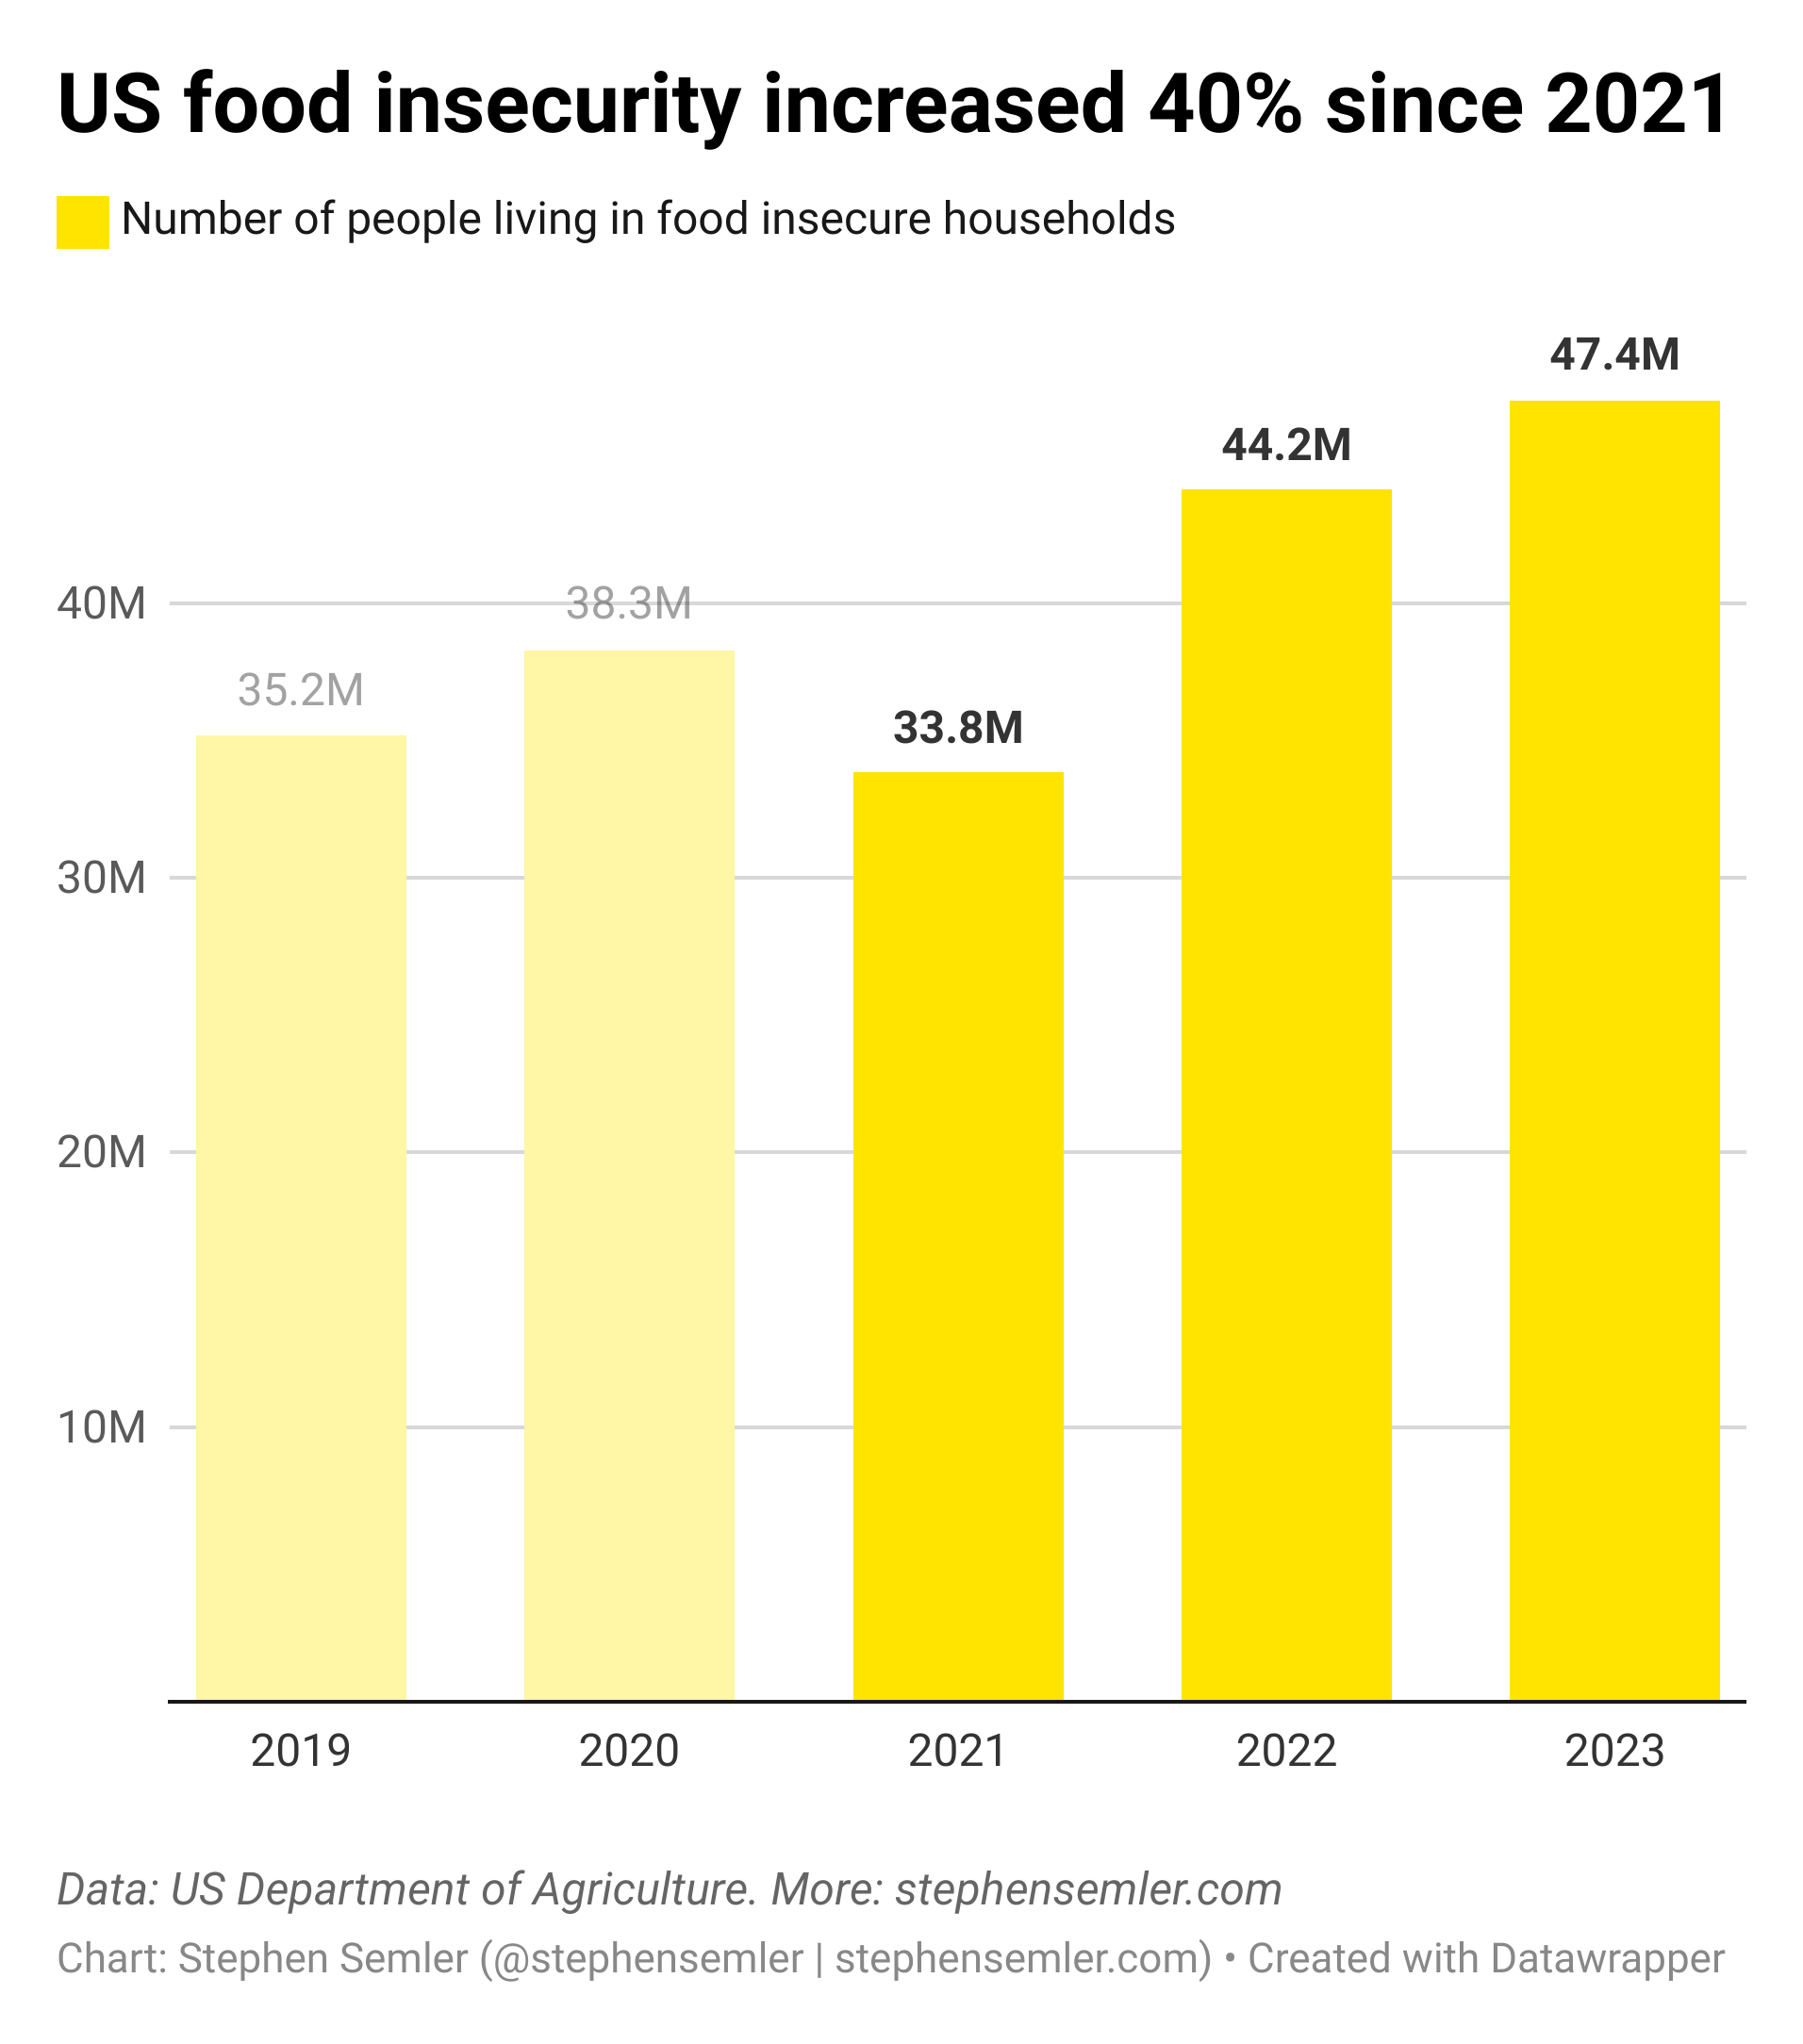
^Alt text for screen readers: US food insecurity increased 40% since 2021. This graph shows the number of people living in food insecure households in millions. 2019, 35.2; 2020, 38.3; 2021, 33.8; 2022, 44.2; 2023, 47.4. Data: US Department of Agriculture.

^Alt text for screen readers: Poverty in the US increased 67% since 2021. This graph shows the number of people living below the poverty line in millions. 2019, 38.3; 2020, 30; 2021, 25.6; 2022, 40.9; 2023, 42.8. Data: US Census Bureau.
SPECIAL THANKS TO: Alan F., Alex T., Andrew R., Bart B., BeepBoop, Bill S., Bob N., Brett S. Byron D., Chris G., David S.,* David V.,* Elizabeth R., Francis M., Frank R., Gary W., George C., Griffin R., Hans S., Irene B., Isaac S., James H., James N., Jcowens004, Jerry S., Joe R., John A., Joseph B., Kheng L., Linda B., Linda H., Lindsay S.,* Lora L., Marie R., Matthew H.,* Megan., Meghan W., Michael S., Nick B., Omar D.,* Peter M., Philip L., Rosemary K., Silversurfer7, Spookspice2, Springseep, Theresa A., Themadking724, Tim C., Timbuk T., Tony L., Tony T., Viviane A.
* = founding member
-Stephen (Follow me on Instagram, Twitter, and Bluesky)
This was to avoid having to explain to people the difference between percentage point and percent change. For example, there are people out there who would see the poverty rate of 7.8% in 2021 and the 12.9% rate in 2023, and say there was a negligible 5% increase — not an alarming 65% jump — in poverty during that stretch.
Why are your numbers in the poverty graph different from these from the Census Department? "2021: The official poverty rate was 11.6%, with approximately 37.9 million individuals living in poverty. 2022: The rate slightly decreased to 11.5%, encompassing about 37.9 million people. 2023: The rate further declined to 11.1%, with around 36.8 million individuals in poverty." https://www.census.gov/library/publications/2024/demo/p60-283.html Doubtless I'm missing something!