
Falling wages, spiraling credit card debt
Polygraph | Newsletter n°341 | 16 May 2026

IN THIS NEWSLETTER: Credit card debt and the erosion of economic security.
*My latest for Popular Information: The real cost of the Iran War: $72 billion for the first 60 days
*Coverage of my war cost estimate: Expert: Iran war cost $72 billion over first two months ; Expert Puts True Cost of Trump’s Iran War at $72 Billion—Nearly 3 Times Higher Than Pentagon Said ; How Much Has the Iran War Actually Cost? A Lot More Than $25 Billion
Situation
The Iran War has pushed inflation to its highest point since May 2023. Gasoline prices, for example, are 28% higher than last year. Fresh vegetables cost 12% more; coffee, 18.5%. The list goes on.
Wages haven’t kept up with rising prices. This week, the US Department of Labor reported a 0.5% drop in “real” (inflation-adjusted) average hourly earnings in April and a 0.3% drop over the previous 12 months.
In the context of record household debt, the reported drop in wages is even worse than it sounds.
The debt blind spot
The Bureau of Labor Statistics uses the Consumer Price Index (CPI) to calculate real wages. CPI has several shortcomings,1 one of which is the exclusion of debt. Debt is experienced as a rapidly increasing cost at the household level but isn’t incorporated into the price index the way other household costs are. This further strains the link between real wages and real economic security — the ability to reliably make ends meet. As economist Nathan Tankus explained in his 2024 election autopsy:
“Ordinary households do not respect the boundaries of the Bureau of Labor Statistics methodologies. Most Americans are not aware, nor do they care, that mortgage interest rates were removed from price indices by the Bureau of Labor Statistics in 1983. They also do not care that credit card interest rates are not in these indices either. As far as they are concerned interest rates are a price they pay — and both those interest rates went way up over the past few years.”
Credit card debt
Since 2019, US credit card debt has risen 14% faster than inflation ($848 billion to $1.252 trillion). The average monthly card payment has increased 6% faster ($1,492 to $1,994).2
The number of cardholders unable to pay their monthly credit card balance has grown by 11% since 2019 (99.96 million to 111.4 million). The number making only the minimum payment or less has also grown by 11% (24.78 million to 27.54 million).3 The share of credit card debt 90+ days delinquent in the first quarter of 2026 is the highest it has been since the first quarter of 2011.4 More than a fifth of cardholders incurred a late fee in the previous year.5 Meanwhile, JPMorgan Chase, American Express, Capital One and Citigroup collected $146 billion in credit card revenue last year.
Spiraling credit card debt reflects (and compounds) the deteriorating economic security in the richest country in the world. Two facts illustrate this point. First, the personal savings rate dropped by 51% from 2019 to 2026.6 Second, it’s nearly 30% more expensive to have the same unpaid balance in 2026 than in 2019, as credit card APR increased from 17% to 22%. I’m reminded of that James Baldwin quote about how expensive it is to be poor.
The Iran War will amplify credit card debt’s effect on economic insecurity. Since the US and Israel started the war, lower- and middle-income Americans have increasingly relied on debt to sustain household spending. The economic fallout will worsen as the war drags on, which appears to be the commander-in-chief’s intent. Waging war is not only central to Trump’s politics; it’s a defining feature of the performative “peace through strength” foreign policy doctrine championed by Republicans and tacitly enabled by Democrats.
I’ll leave you with two charts. The first shows the recent surge in credit card debt; the second shows how much more expensive that debt is to carry.
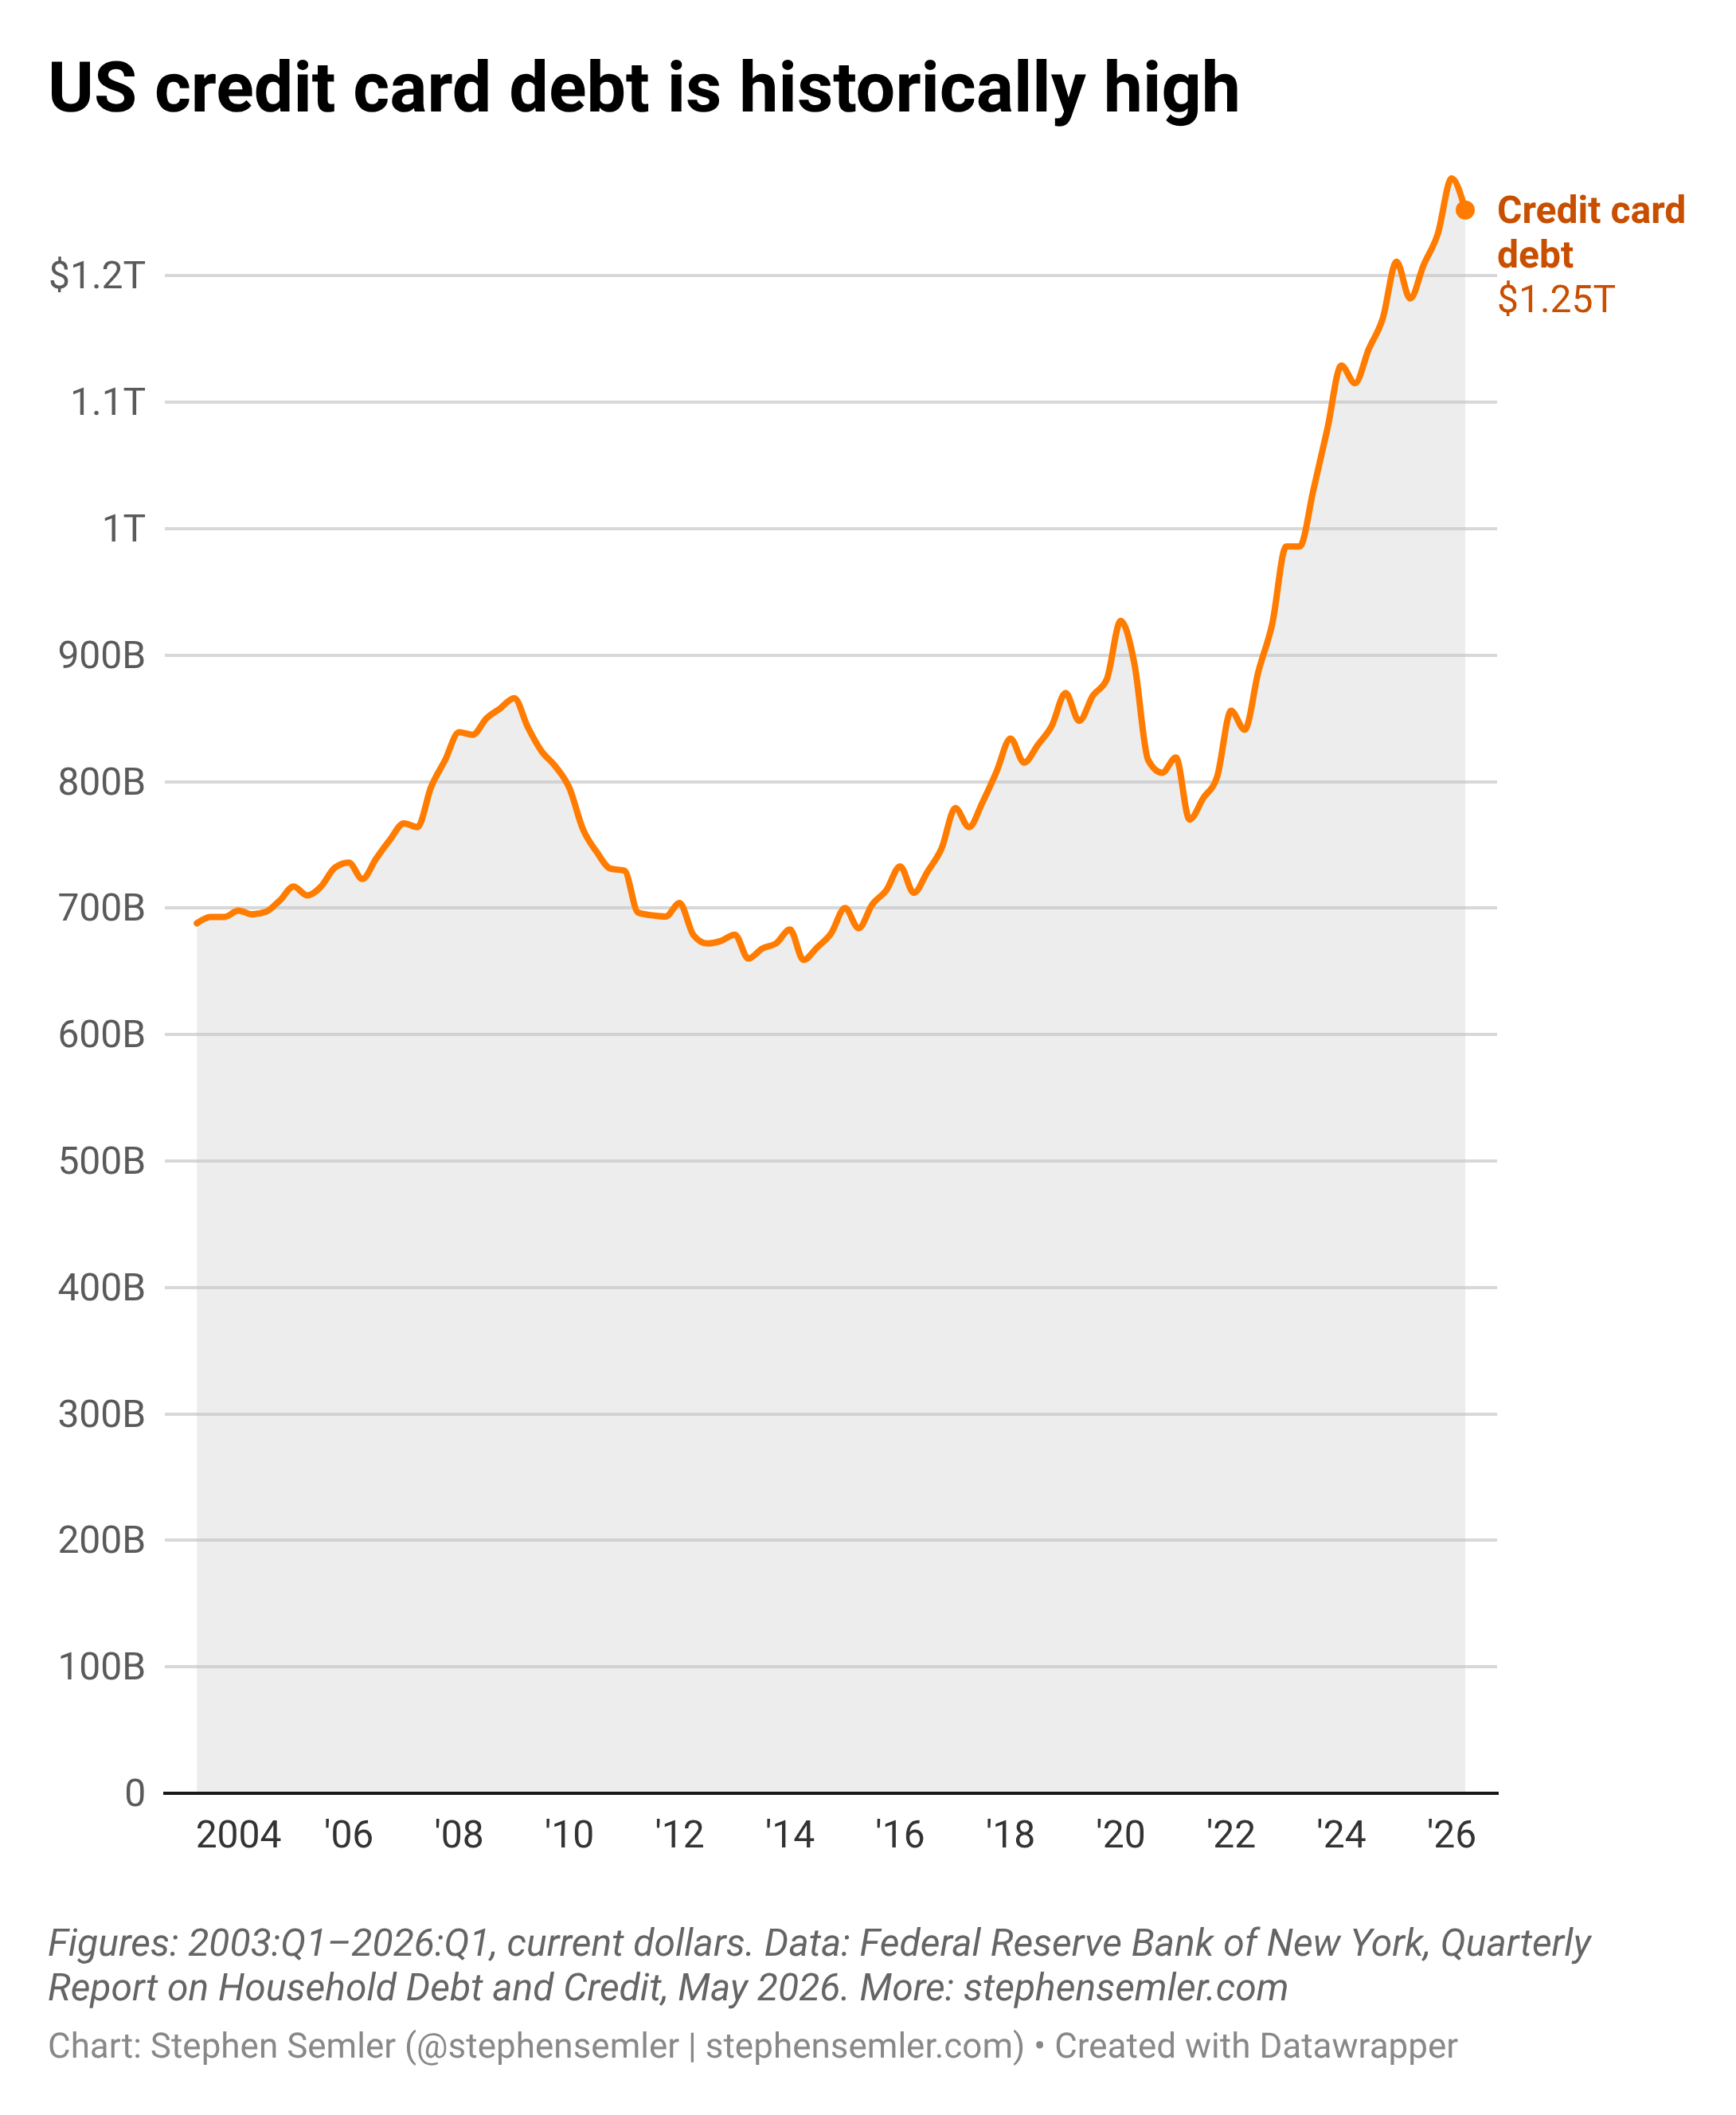
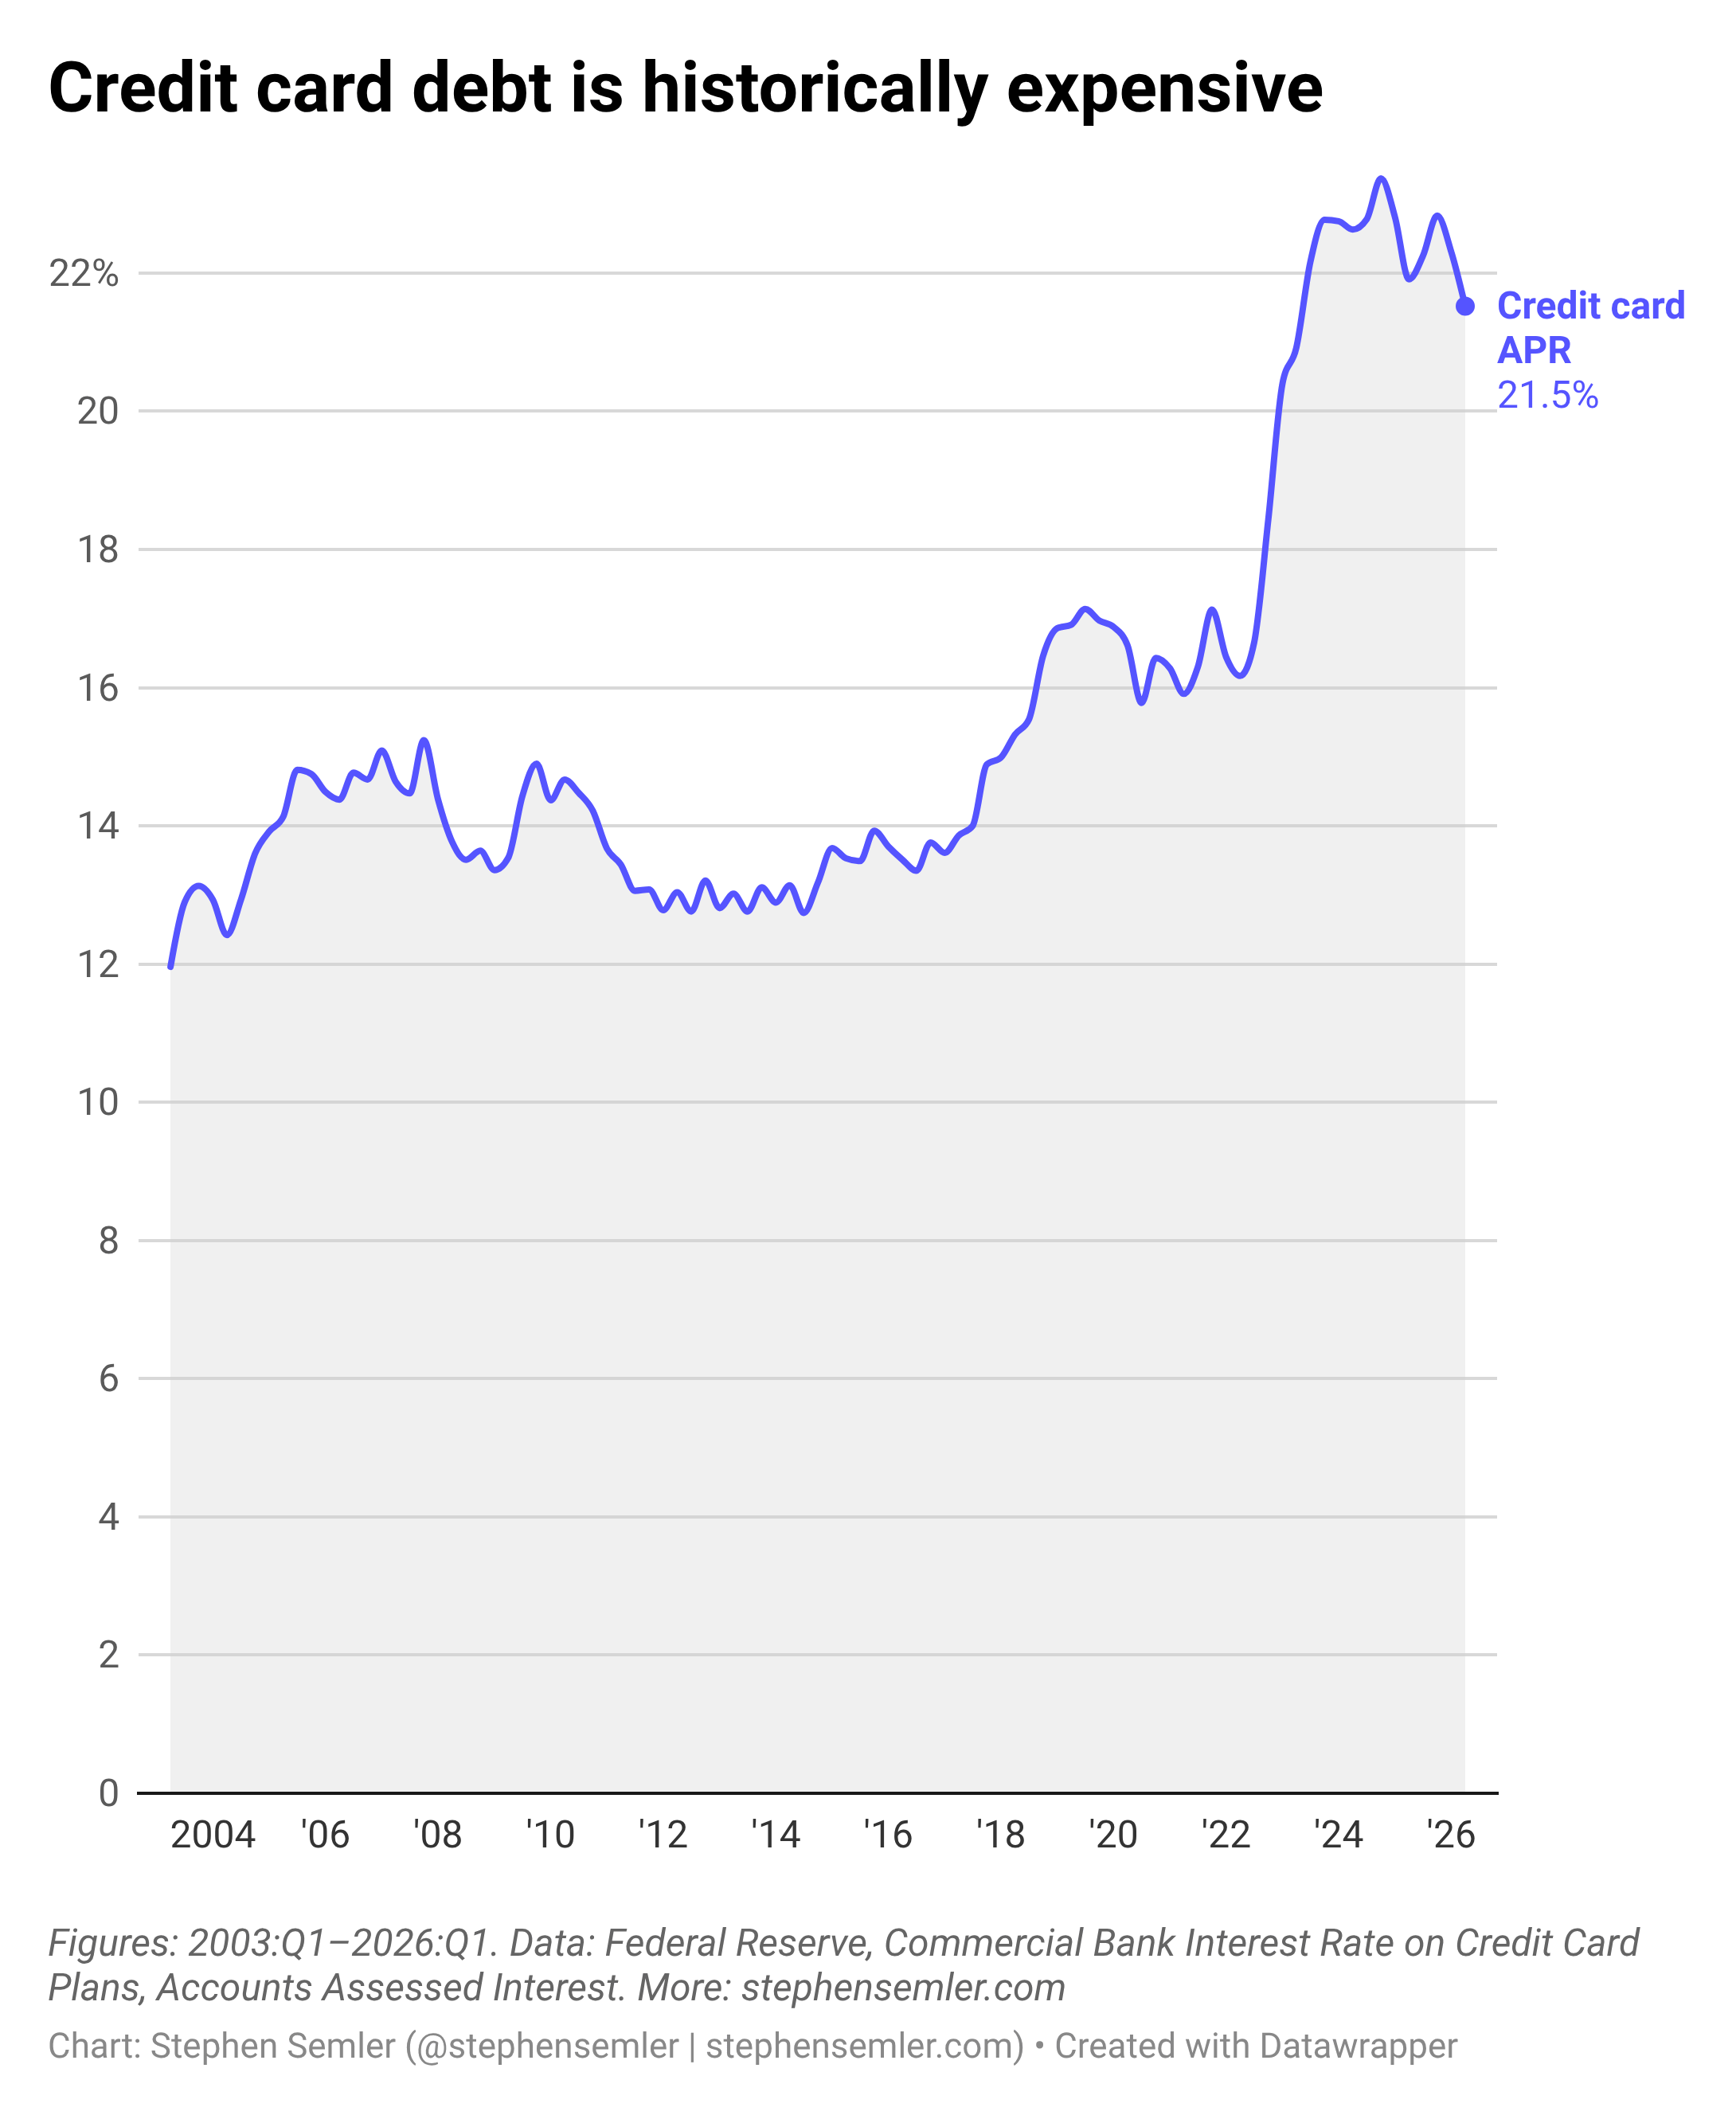
^Alt text for screen readers: Top chart: U.S. credit card debt is historically high. Orange line chart starts at roughly $700 billion in 2003 and ends with $1.25 trillion in the first quarter of 2026, with peaks of approximately $850 billion and $875 billion in 2008 and 2019, and troughs of approximately $675 billion from in 2013 and $800 billion in 2021. Figures: 2003:Q1-2026:Q1, current dollars. Data: Federal Reserve Bank of New York, Quarterly Report on Household Debt and Credit, May 2026. Bottom chart: Credit card debt is historically expensive. This purple line chart shows credit card APR (annual percentage rate) starting at 12.7% in 2003 and ending at 21.5% in the first quarter of 2026, fueled by a rapid increase after 2021. Since 2023, credit card APR has hovered around 22%. Figures: 2003:Q1-2026:Q1, current dollars. Data: Federal Reserve, Commercial Bank Interest Rate on Credit Card Plans, Accounts Assessed Interest.
SPECIAL THANKS TO: Abe B., Alan F., Alexander L., Alissa Q., Amin, Andrew R., AT., B. Kelly, Barbara B., Bart B., BeepBoop, Ben, Ben C.,* Bill S., Bob N., Brett S., Byron D., Carol V., Catherine L., Chris, Chris G., Claudia, Cole H., Coleman J., D. Kepler, Daniel M., Dave, David J., David S.,* David V.,* David M., Dharna N., Elizabeth R., Emily H.,* Errol S., Ethan R., Foundart, Fran Q., Francis M., Frank R., Fred R., Gary W., Gladwyn S., Graham P., Griffin R., Heath P., Hunter S., IBL, Irene B., Isaac, Isaac L., Jacob, James G., James H., James N., Jamie LR., Jcowens, Jeff, Jennifer, Jennifer J., Jessica S., Jerry S., Joe R., John, John, John A., John K., John M., Jonathan S., Joseph B., Joshua R., Julia G., Julian L., Katrina H., Keith B., Kesh L., Kheng L., Lea S., Leah A., Leila CL., Lenore B., Linda B., Linda H., Lindsay, Lindsay S.,* Lora L., Lou B., Mapraputa, Marie R., Mark L., Mark G., Marvin B., Mary Z., Marty, Matthew H.,* Megan., Melanie B., Michael S., Mitchell P., Nick B., Noah K., Norbert H., Omar A., Omar D.,* Peter M., Phil, Philip L., Ron C., Rosemary K., Sari G., Scarlet, Scott H., Silversurfer, Soh, Springseep, Stan C., TBE, Teddie G., Theresa A., Themadking, Tim C., Timbuk T., Tony L., Tony T., Tyler M., Victor S., Viviane A., Wayne H., William H.,* William P.
* = founding member
-Stephen (Follow me on Instagram, Twitter, and Bluesky)
For example, one flaw with CPI and thus real wages (aside from the debt thing described in this article) is that it’s tilted toward what rich people buy. This is because rich people buy more stuff. If inflation is disproportionately based on the spending habits of the wealthy, cost growth in areas like housing — which non-wealthy people spend far more on as a percentage of their income — is understated in the overall price index and thus in real wages. It just so happens that housing experienced the steepest price increases over the last several years.
The annual income needed to afford a median-priced home has skyrocketed, increasing from $70K in 2021 to $120K in 2024, easily outpacing wages. Rent costs have outpaced wages too: according to the Zillow Observed Rent Index (ZORI) for rentals, average rent cost increased from $1,376 per month to $1,842 per month from 2019 to 2024, while nominal household median income increased from $68,700 to $83,730 during the same stretch. So while incomes rose by 22%, rent costs increased by 34%.
The bottom line is that real wages alone cannot be used as a barometer of economic security, but some people do anyway — mostly partisans (when their preferred party isn’t in power) and emitters of the “vibecession” narrative, who assert that the affordability crisis is a product of people’s imaginations. The latter group carefully selects a date range that shows real wage growth and reflexively points to it whenever confronted with data showing pervasive economic and food insecurity. Because this amounts to a nerdy yet empirically deficient way of telling people they’re fine when they’re not, this farcical and politically poisonous practice is increasingly unpopular. Nowadays, it’s largely concentrated in the White House and on Bluesky, less a social network than a sarcophagus preventing liberal smugness from reaching the broader public. (That said, feel free to follow me on Bluesky at @stephensemler.bsky.social.)
Mistakenly put 18% and 8% instead of 14% and 6% originally. Inflation adjusted using CPI (Bureau of Labor Statistics via FRED), rebaselined 1.000=Q1 2026. Credit card debt data via New York Fed, comparing Q1 2019 to Q1 2026. Monthly payment data via this TCF analysis of UC-CCP survey data. Here I compared Q4 2019 with Q4 2025, because data only goes through Q4 2025 and I didn’t want seasonal variations to affect the comparison.
*Why I didn’t use CDSP in this analysis: The Federal Reserve has a dataset on consumer debt service payments as a share of disposable income (CDSP), but I didn’t use it for a few reasons. First, CDSP doesn’t only refer to credit card debt. Second, CDSP is a nationwide aggregate and high-income households hold a disproportionate share of aggregate disposable income. So while people in low- and middle-income brackets have experienced surging credit card debt that outpaces their wages, their financial distress can be statistically masked in national percentages by the healthier balance sheets of upper-income brackets. Third, personal income (disposable personal income = personal income – personal taxes) is a broad category that includes nonmoney government and employer benefits. It also factors in money that isn’t readily disposable, including employer contributions to people’s 401(k) and pensions, which isn’t exactly the same as available, on-hand cash that can easily be disposed of. This results in an expanded denominator when calculating the debt service ratio that understates how burdensome credit card debt actually is. Fourth, CDSP’s scheduled payment reported for credit cards is the minimum required payment. While credit card balances and APRs have reached record nominal highs, banks still calculate monthly minimum payments as a very small percentage of the total balance (usually 1% to 2% plus interest). This means the massive spike in credit card debt translates into a much smaller, slower uptick for that input into the debt service ratio.
Both 11% figures refer to Q4 2019 to Q4 2025. Data via this TCF analysis of UC-CCP survey data.
13.2% for both Q1 2011 and Q1 2026. Data via New York Fed, Quarterly Report on Household Debt and Credit, May 2026.
Personal saving as a percentage of disposable income fell from 8.2% in Q1 2019 to 4.0% in Q1 2026. Data via the US Bureau of Economic Analysis.