
Nearly 1 in 4 US tenants fell behind on rent in 2025
Polygraph | Newsletter n°343 | 15 Jun 2026

IN THIS NEWSLETTER: There are 46 million renter households in the US. The share behind on rent has more than doubled since 2019.
*Thank you, Tom B. and Troy, for becoming paid subscribers! Join Tom, Troy, and the other Polygraph VIPs to support my work.
Housing security is deteriorating in the country that just produced the world’s first trillionaire. Nearly one in four tenants fell behind on rent in 2025, according to the Federal Reserve’s latest report on household economic well-being. At 23%, the share who fell behind on rent last year was two percentage points higher than in 2024, six points above 2022, and 13 points above 2019.1 That’s as far back as the Fed’s survey data goes.2
There are two graphs below. The first shows the share of tenants behind on rent, broken down by income.3 The second shows average US monthly rent.4 As you’d expect, the two graphs move in sync. Nearly.
The 7 percentage point rise in tenants behind on rent from 2019 to 2021 coincided with an 11% increase in rent, including a 9% increase in 2021, alongside a global pandemic and economic recession. But when rent shot up 12% in 2022 alone, there wasn’t a corresponding increase in tenants behind on rent — it even fell a percentage point among those with incomes between $50,000 and $100,000. At least not in 2022. The impact of that price shock became apparent in the data a year later.
One explanation for the apparent lag is that the pandemic welfare state, despite beginning to unravel, was still fairly robust in 2022 — extra SNAP benefits, Medicaid continuous enrollment, child care stabilization grants, student loan pause, emergency rental assistance, ACA enhanced subsidies, and more remained active — which helped folks withstand the initial onslaught of spiraling rental costs on their household budgets. Another, more grim explanation is that people stayed current on rent by first exhausting their savings before turning to borrowing. The meteoric rise in credit card debt and historic decline in personal savings in 2022 lend credence to this theory.
Both had a limited shelf life while higher rents were here to stay. The share of tenants behind on rent grew by 2 percentage points in each of the next three years, and by an average of 3 points among renters with incomes below $100,000.
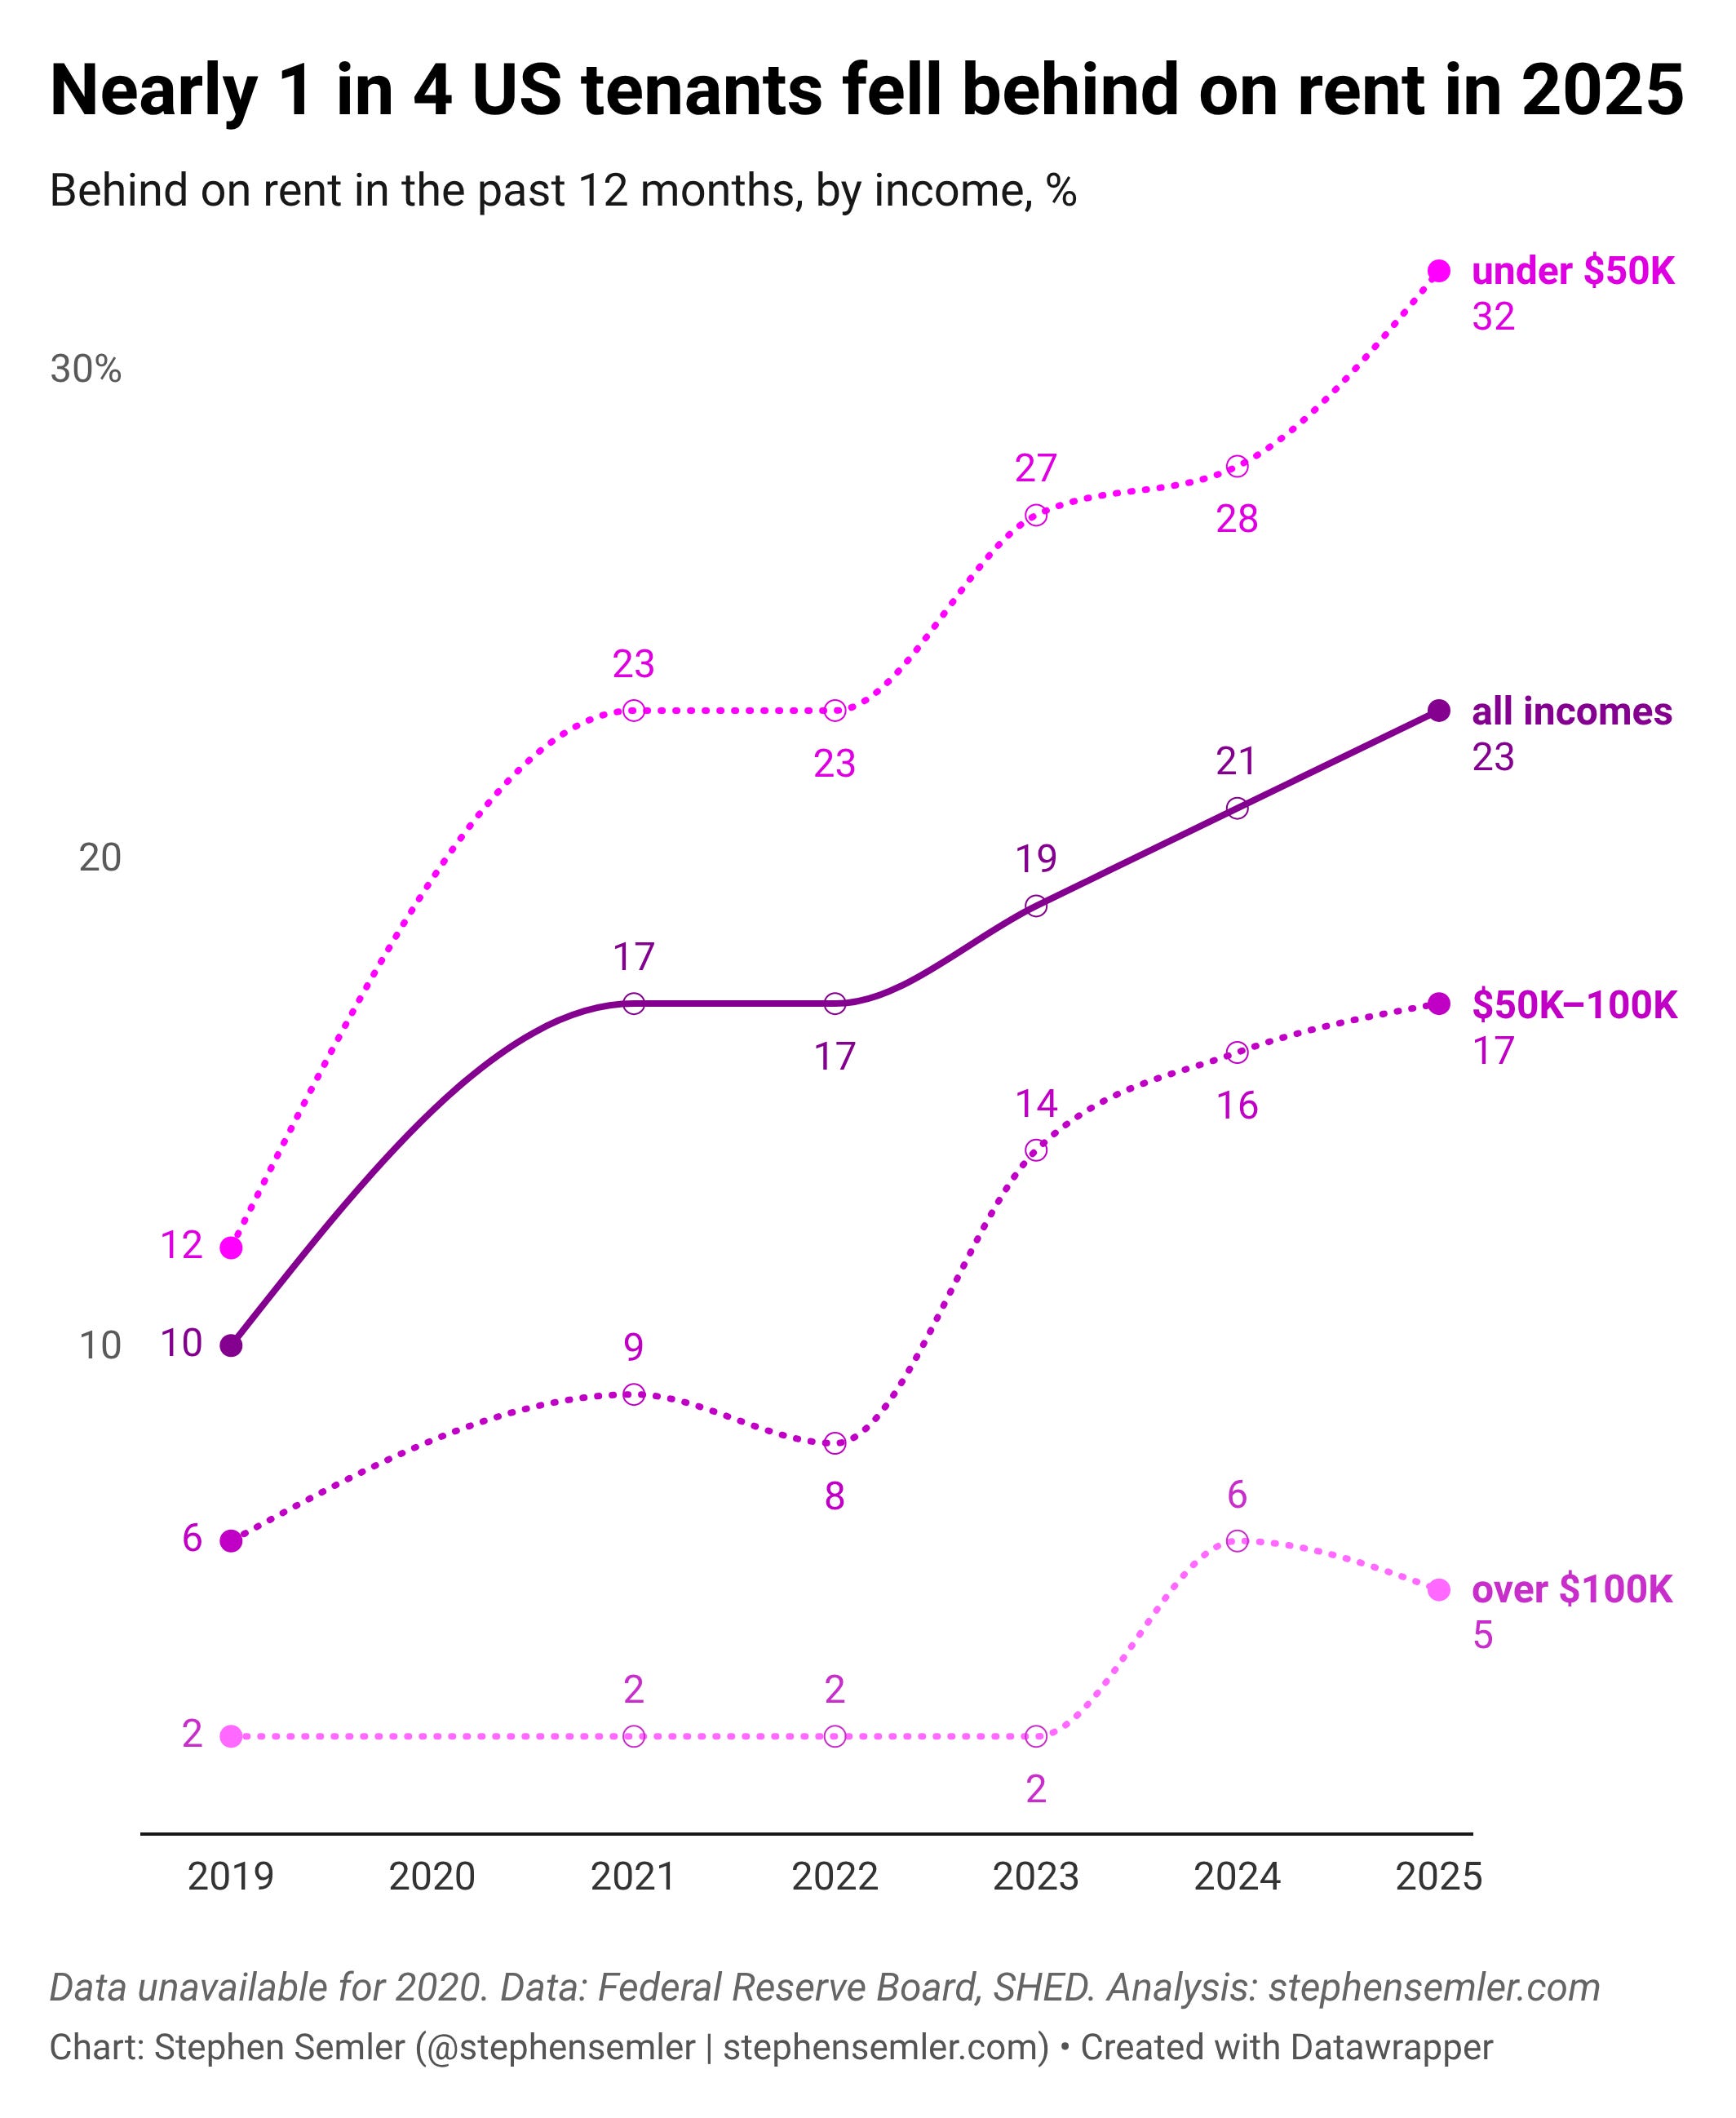
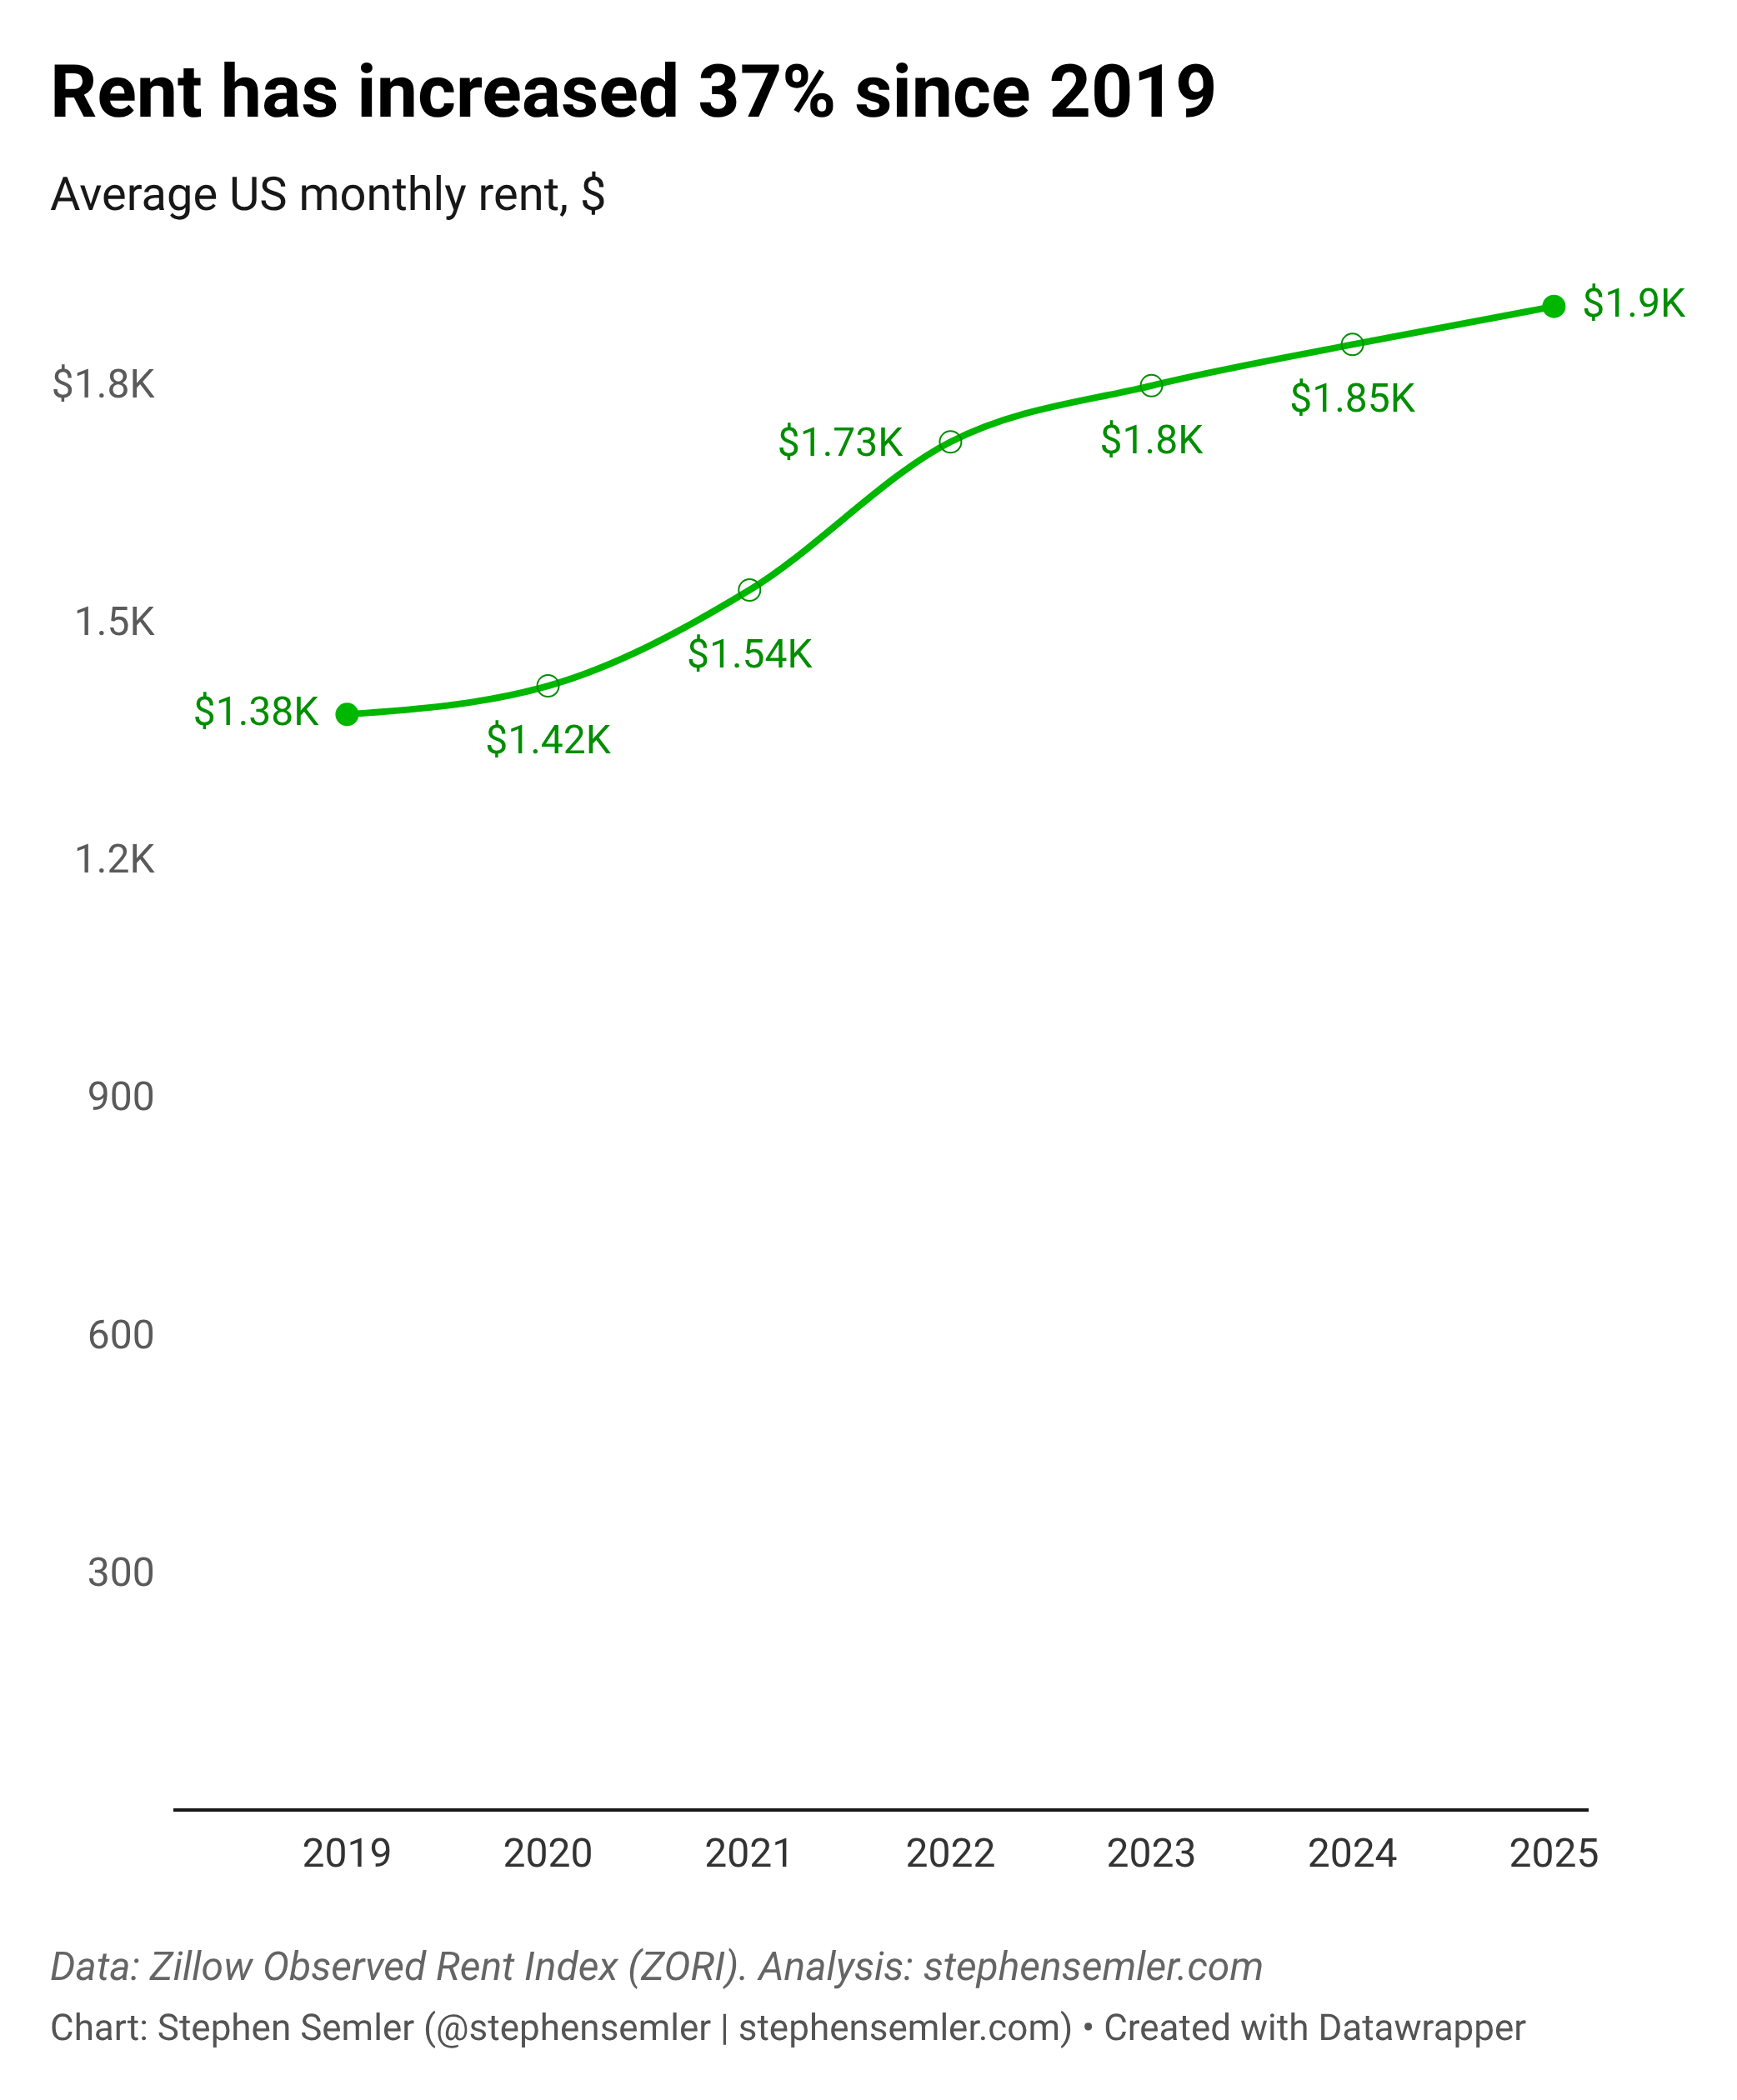
^Alt text for screen readers: Top chart: Nearly 1 in 4 US renters fell behind on rent in 2025. Share behind on rent in the past 12 months, by income. All incomes: 2019, 10%; 2021, 17%; 2022, 17%; 2023, 19%; 2024, 21%; 2025, 23%. Incomes under $50,000: 2019, 12%; 2021, 23%; 2022, 23%; 2023, 27%; 2024, 28%; 2025, 32%. Incomes from $50,000 to $100,000: 2019, 6%; 2021, 9%; 2022, 8%; 2023, 14%; 2024, 16%; 2025, 17%. Incomes over $100,000: 2019, 2%; 2021, 2%; 2022, 2%; 2023, 2%; 2024, 6%; 2025, 5%. Data: Federal Reserve Board, Survey of Household Economics and Decisionmaking (SHED). Bottom chart: Rent has increased 37% since 2019. Average US monthly rent: 2019, $1,383; 2020, $1,419; 2021, $1,540; 2022, $1,727; 2023, $1,798; 2024, $1,850; 2025, $1,898. Data: Zillow Observed Rent Index (ZORI).
SPECIAL THANKS TO: Abe B., Alan F., Alexander L., Alissa Q., Amin, Andrew R., AT., B. Kelly, Barbara B., Bart B., BeepBoop, Ben, Ben C.,* Bill S., Bob N., Brett S., Byron D., Carol V., Catherine L., Chris, Chris G., Claudia, Cole H., Coleman J., D. Kepler, Daniel M., Dave, David J., David S.,* David V.,* David M., Dharna N., Elizabeth R., Emily H.,* Errol S., Ethan R., Foundart, Fran Q., Francis M., Frank R., Fred R., Gary W., Gladwyn S., Graham P., Griffin R., Heath P., Hunter S., IBL, Irene B., Isaac, Isaac L., Jacob, James G., James H., James N., Jamie LR., Jcowens, Jeff, Jennifer, Jennifer J., Jessica S., Jerry S., Joe R., John, John, John A., John K., John M., Jonathan S., Joseph B., Joshua R., Julia G., Julian L., Katrina H., Keith B., Kesh L., Kheng L., Lea S., Leah A., Leila CL., Lenore B., Linda B., Linda H., Lindsay, Lindsay S.,* Lora L., Lou B., Mapraputa, Marie R., Mark L., Mark G., Marvin B., Mary Z., Marty, Matthew H.,* Megan., Melanie B., Michael S., Mitchell P., Nick B., Noah K., Norbert H., Omar A., Omar D.,* Peter M., Phil, Philip L., Ron C., Rosemary K., Sari G., Scarlet, Scott H., Silversurfer, Soh, Springseep, Stan C., TBE, Teddie G., Theresa A., Themadking, Tim C., Timbuk T., Tom B., Tony L., Tony T., Troy, Tyler M., Victor S., Viviane A., Wayne H., William H.,* William P.
* = founding member
-Stephen (Follow me on Instagram, Twitter, and Bluesky)
I do not pay rent, as I am kept in a dungeon and forced to make charts all day.
This analysis uses data from the 2025 Survey of Household Economics and Decisionmaking (SHED), as well as the 2024, 2023, 2022, and 2021 iterations. The 2021 survey also asked respondents about falling behind on rent in 2019. There’s no data for 2020.
Methodological caveats apply. The Federal Reserve Board notes that income “is not comparable prior to 2023 because of changes to question wording.” I compared them anyway. The change in wording did not strike me as significant enough to warrant excluding all data prior to 2023. (Here is the wording for the 2022 and 2025 surveys, respectively.) I rebinned survey respondents’ incomes to fit into the “under $50K” “$50–100K” and “over $100K” based on survey weights using each survey year’s codebooks and public use files. The question about being behind on rent was not asked in either the 2019 or 2020 surveys. Data for 2019 comes from the 2021 survey, in which respondents were asked about falling behind on rent in 2019 (pre-pandemic). This means the income data for renters for 2019 reflects their 2021 income. It also means that some respondents could have forgotten about falling behind on rent in 2019, while others could have reported falling behind on rent in 2019 when it actually occurred, for example, in late 2018 or early 2020 instead. The bottom line is that the 2019–2025 graphical display you see in this analysis is not one you’ll likely see in an academic context due not being methodologically consistent to the letter, but is one you’d see in a public policy space, where a bit of wiggle room is allowed for the sake of providing more timely information. There’s a good conversation about the differences between academic and policy analysis in this book.
Data via Zillow Observed Rent Index — ZORI (Smoothed): All Homes Plus Multifamily Times Series ($) — in nominal dollars. Per Zillow: “ZORI is a repeat-rent index that is weighted to the rental housing stock to ensure representativeness across the entire market, not just those homes currently listed for-rent. The index is dollar-denominated by computing the mean of listed rents that fall into the 35th to 65th percentile range for all homes and apartments in a given region, which is weighted to reflect the rental housing stock.” ZORI methodology, here. Of course, the 37% increase in average monthly national rent (shown in the graph) wasn’t geographically uniform. Rent increased 32% in Pittsburgh, PA (the Paris of the Appalachians) from 2019–2025, but 41% in Bloomington, IN, for example. The increase in dollars wasn’t uniform, either. New York, NY, had a 32% increase in monthly rent — same as Pittsburgh — but that works out to about $800 more per month in New York compared to $350 more in the Paris of the Appalachians.
It looks to me like the increase in rents from 2019 to 2026 roughly tracks the inflation rate during that period, maybe a slight bump higher. So, if that is the case, then the problem appears to be that wages/incomes have simply not kept pace with inflation, causing distress among renters. The federal minimum wage has not been raised since 2009 when it was set at $7.25/hr. If it had kept pace with inflation it would be around $11.50/hr today. Still inadequate but better than the raw deal workers get today.