
US spends $2.1 billion a day on the Iran War
Polygraph | Newsletter n°337 | 2 Apr 2026

IN THIS NEWSLETTER: In the first two weeks of the Iran War, the US spent an estimated $2.1 billion per day, on average. Here’s how.
Big thanks to Fran Q., Polygraph’s latest VIP member! Join Fran and the other paid subscribers thanked at the bottom of each note if you’d like to support my work.
Latest VIP newsletter: Iran War: Cost of the first week
How much has the US spent on the Iran War?
The Trump administration won’t say and prefers the cost not be discussed.
The US spent an estimated $28.7 billion in the first two weeks of the Iran War, or $2.1 billion a day on average. This is based on my analysis of officials’ statements, federal procurement and operations data, and reporting on military deployments and armament use. This estimate refers only to direct war costs — near-term expenses for military operations, munitions, and the like — and not indirect costs, which include broader and longer-term factors like economic impact and veterans’ care.
This might be a higher estimate than you’ve seen elsewhere. Those estimates are too low. This one could be too.
Below:
Summary table
Why most estimates are too low
Why this estimate could be too low
Methodology and itemized war costs
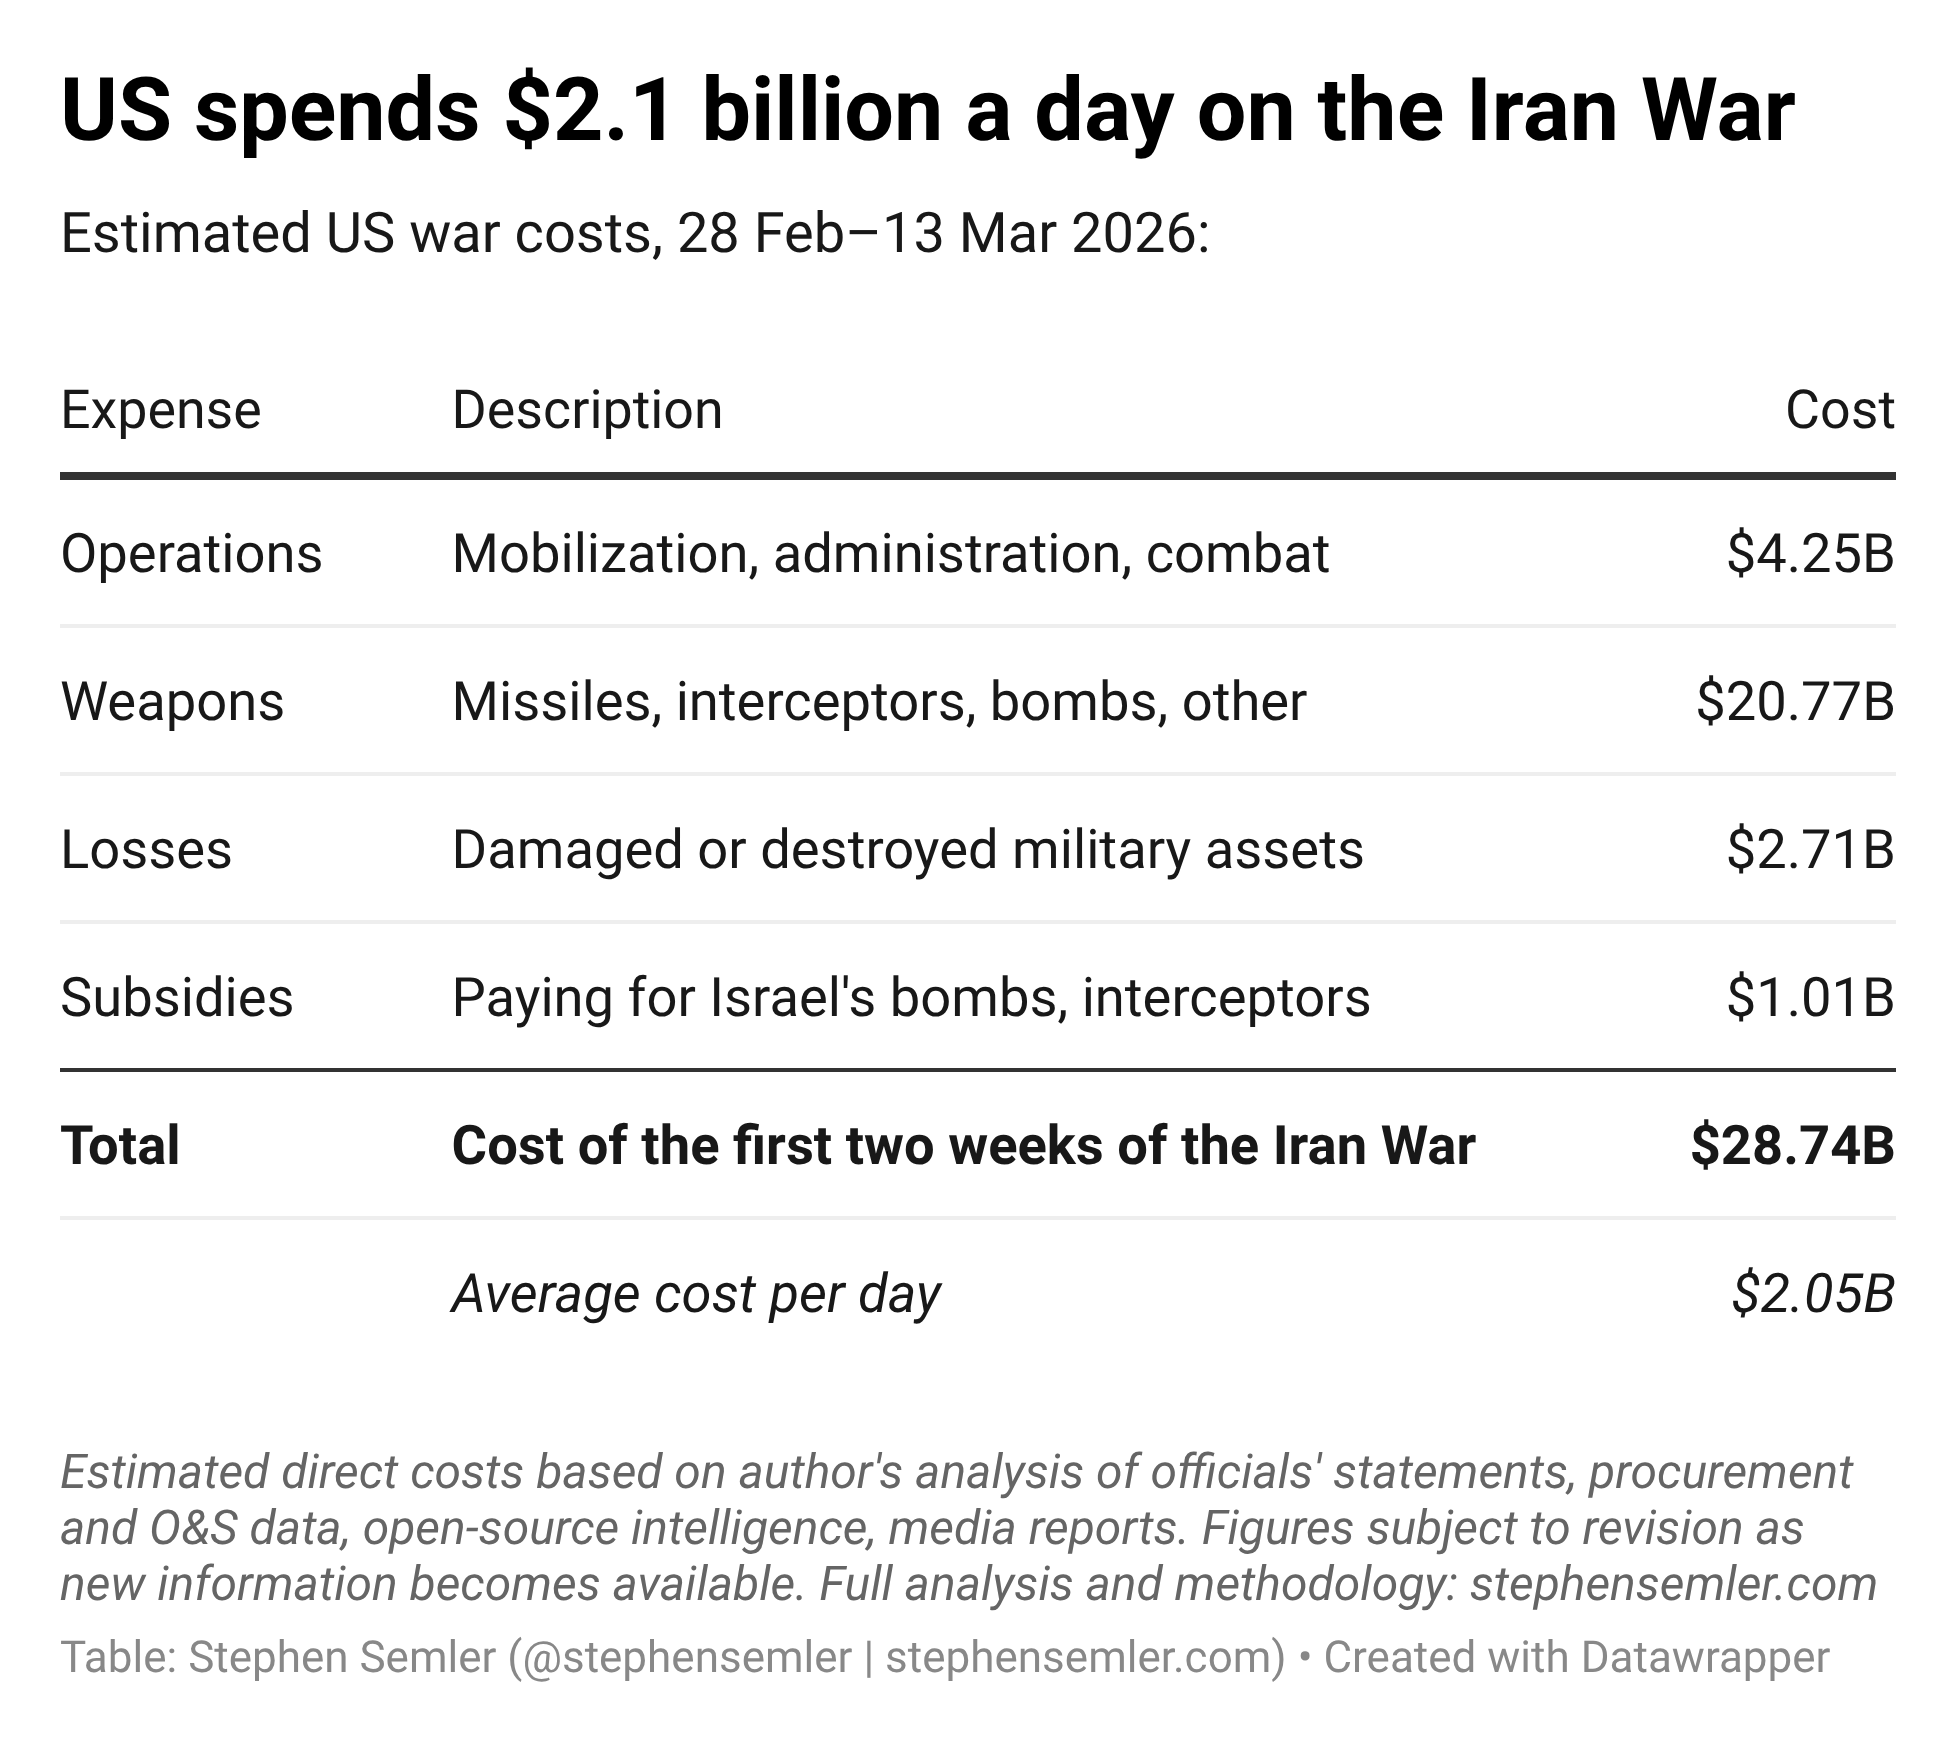
^Alt text for screen readers: US spends $2.1 billion a day on the Iran War. Estimated US war costs, 28 February–13 March 2026. Table format: Expense; Description; Cost. Rows: Operations; Mobilization, administration, combat; $4.25 billion. Weapons; Missiles, interceptors, bombs, other; $20.77 billion. Losses; Damaged or destroyed military assets; $2.71 billion. Subsidies; Pay for Israel’s bombs, interceptors; $1.01 billion. Total; Cost of the first two weeks of the Iran War; $28.74 billion. Average cost per day: $2.05 billion. Estimated direct costs based on author’s analysis of officials’ statements, procurement and O&S data, open-source intelligence, media reports. Figures subject to revision as new information becomes available.
Why most estimates are too low
In a recent closed-door briefing with select lawmakers, Pentagon officials estimated the war had cost $11.3 billion in the first week. That figure, despite not accounting for much besides munition expenses, is the closest the Trump administration has come to saying how much it’s spending on the Iran War. Mainstream media outlets repeat the figure over and over, as their compulsive need to cite figures from government officials clashes with officials not giving any. It’s also the basis for popular cost estimates from think tanks.
For example, CSIS originally said the war had cost $3.7 billion over the first 100 hours, which became one of the most widely cited estimates, though probably not for the reason CSIS intended. In the media, the chasm between the CSIS and Pentagon estimates became a popular trope for how the cost of the Iran War was smashing expectations.1 CSIS then released another estimate — this one built pretty much entirely around the Pentagon’s — which became popular in its own right, even serving as the basis for estimates by news outlets and other think tanks.
The prevailing war cost estimates have two things in common. First, they’re all better than the dozens of AI-generated war cost trackers, which are empty calories empirically. Worse, they’re unaccountable. Numbers wrong? Blame the model. There’s no one to hear your justifiable criticism; it’s like being cut off in traffic by a driverless car.
Second, because the prevailing cost estimates are ultimately based on the Pentagon’s, they reproduce its inherent flaws. The biggest is munition expenditures (which is pretty much all the Pentagon’s estimate included, given all the other types of war costs it left out). The result is a pervasive understatement of how expensive the Iran War actually is.
The Pentagon tracks munition “burn rate” costs by merging operational logistics (what’s being fired in what quantities) with financial values (what each one costs). My beef is with how it determines unit costs. I don’t think the Pentagon’s method is wrong; I do think it’s irrelevant — so immersed in the internal logic of departmental bookkeeping that its conclusions are too insular to be of much use. The war costs that show up on the Pentagon’s ledger are different (read: lower) than the war costs the US public will be asked (read: forced) to pay.
For example, the Navy logs the number of SM-2 interceptors it’s firing into the Ordnance Tracking System; that quantity gets fed into the Navy Enterprise Resource Planning system, which multiplies the reported quantity by the SM-2’s current unit cost; that figure goes into the Agency Financial Report, which eventually gets rolled up into the Pentagon’s consolidated financial statements. The cost to fire one SM-2 is based on something called Moving Average Cost, which determines unit cost by dividing the total value of the SM-2’s stockpile by the number of SM-2s in it. The value of a munition’s stockpile is a historical average that changes with every new purchase of that munition. If its unit cost is $1.1 million and 50 are withdrawn from the stockpile and fired, the Pentagon’s ledger would show $55 million in expenses from consuming those munitions. The war cost estimate unnamed Pentagon officials gave lawmakers likely reflects this accounting method, as it’s the department’s standard.
How does this standard lead to underestimates of war costs? The aforementioned interceptor illustrates the mechanics perfectly: The US military has reportedly fired lots of SM-2 interceptors during the Iran War, but the Pentagon doesn’t buy SM-2s anymore; they’re being phased out. The SM-6 — the more advanced and expensive successor — is purchased instead. So each time an SM-2 is fired in the ongoing war, the Pentagon’s accounting system registers a cost closer to the SM-2’s $1.1 million unit cost from 2011 than the $5.3 million unit cost in 2026 for the SM-6 that will replace it. For US taxpayers, the cost of firing 50 SM-2s isn’t $55 million; it’s $265 million.2
Some prevailing estimates have used replacement costs, but for estimates they designed to fit within the Pentagon’s $11.3 billion figure, which reflects Moving Average Cost. Using replacement costs doesn’t correct much when you’re working within a vastly understated pot of funds.
Why this estimate could be too low
Three reasons, among several others:
1. US military assets and personnel poured into the Middle East and Europe as part of a historic buildup ahead of the war. I haven’t yet accounted for the prepositioning of assets, and my estimate for personnel is probably too low. The only pre-war personnel cost I included is for activating reservists, which reflects mobilization at the scale of last year’s war with Iran, adjusted for the 3.8% troop pay increase in 2026. For the June 2025 war, the US mobilized 17,193 reservists — 12,396 deployed to CENTCOM and 4,797 to EUCOM — totaling $1.96 billion, based on my analysis of Army, Navy, Marines, and Air Force budget documents. This money came from the $8 billion war fund made available by Sec. 1421 of P.L. 119-4 and executed on 16 June 2025, a day after Pentagon chief Pete Hegseth announced the US was surging forces into the Middle East in a “defensive” maneuver. The US bombed Iran five days later (using funding from Biden’s Israel aid bill — one of the more obscure reasons why concern over Palestine doesn’t make one a single-issue voter). I haven’t yet found data indicating specifically how much higher my 2026 estimate should be.3
2. The single most expensive military asset reportedly damaged or destroyed by Iranian forces is a $1.3 billion AN/FPS-132 early-warning radar at a US base in Qatar. Because the radar was originally funded by a US foreign military sale to Qatar, I did not include any potential restoration costs for it in my estimate. Methodologically, this is a questionable decision, as it assumes Qatar has the appetite to pay the US to replace a billion-dollar radar destroyed in a war the US basically started for fun. (It certainly wasn’t out of necessity.)
3. Pentagon chief Pete Hegseth said the ongoing war “has seven times the intensity of Israel’s previous operations against Iran during the 12-day war.” If that translates to anywhere near seven times the cost, I’ve badly underestimated US war costs.
Israel spent an estimated $6.7 billion on the 12-day war in June 2025, based on my analysis of Israeli budget documents. In September 2025, the Knesset approved a supplemental bill to cover military costs related to its June war with Iran and its planned “conquering” of Gaza in May. A table from the explanatory section of the bill (below) shows 22.7 billion shekels for the military (lit. “Ministry of Security”), 245 million for national insurance allowances, 6.2 billion for intelligence agencies, and 1.7 billion for interest payments. Ignore the rightmost column with budget codes.
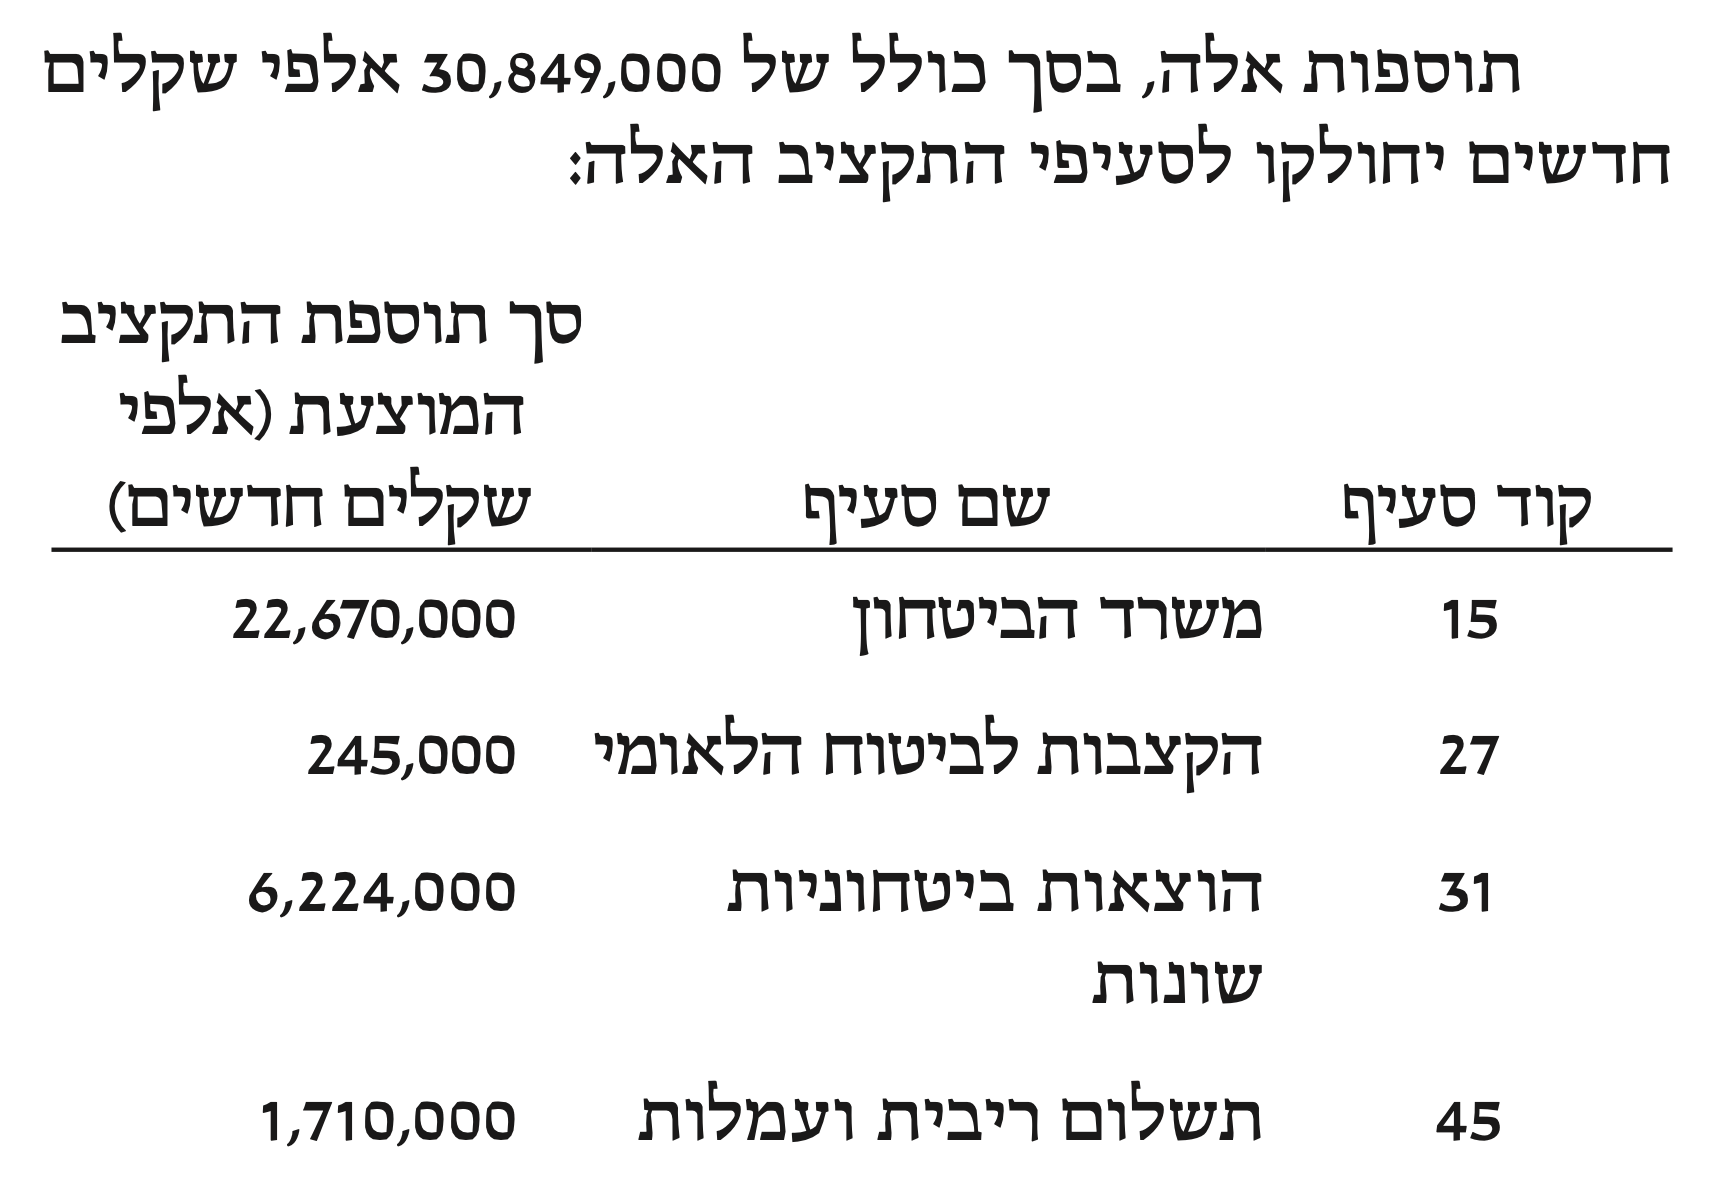
Including the funding for intelligence agencies, there were 28.94 billion shekels in total military spending in the bill, including 6.4 billion for IDF personnel — the bill increased personnel expenses (“הוצאות כח אדם”) to 39.02 billion shekels, up from the 32.66 billion in the original 2025 budget. The Israeli government attributed the additional personnel funding to the May–August 2025 Gaza offensive and the remaining 22.5 billion shekels — $6.7 billion — to the war with Iran.4 This is plausible. The original 2025 budget assumed Israel’s March assault (during the purported ceasefire) but likely did not account for the full costs of its May assault (also during the purported ceasefire). Israel called up tens of thousands of reservists for the May operation, which was plagued by setbacks and ultimately failed, hinting at significant overruns in personnel costs. It’s also plausible that the bulk of the supplemental funding was for the June 2025 war, which quickly went over budget due to operations (including the tens of thousands of flight hours for bombing missions and Mossad actions in Iran), munitions (like the thousands of bombs Israel dropped on Iran), and firing an estimated $1.25 billion in interceptors.
If by “seven times the intensity” Hegseth meant seven times the cost of the June 2025 war, my estimate is about $20 billion too low.
Methodology and itemized war costs
Operations
Estimated cost: $4.25 billion
The Congressional Budget Office (CBO) has data showing how much it costs to operate various combat units. I estimated the type and quantity of units participating in the Iran War by referring to open-source intelligence and media reports. For example, using USNI’s fleet tracker, I counted 15 destroyers operating in the Arabian Sea, Persian Gulf, Red Sea, and Eastern Mediterranean at the start of the war. Each costs $4.2 million per week to operate.
However, CBO’s data is calibrated to peacetime and not wartime, and war makes everything more expensive, including war.
To estimate how much more expensive war makes military operations, I analyzed operating (specifically, Operation and Support) spending in the regular or “base” Pentagon budget and in the supplemental war budget from 2003–2014. To isolate the proportional increase in operating costs attributable to war, I did two things. First, I measured wartime operations spending relative to base operations spending rather than in absolute terms to help control for cost growth not directly related to war (base operations spending rose by roughly 13% above inflation from 2003–2014). Second, I measured operations spending on a per–active-duty troop basis to help control for cost growth solely attributable to the scale of the Iraq and Afghanistan wars.
War increased operating costs by 33% on average from 2003–2014, which translates to a 1.33 wartime operating cost multiplier that I used to convert the CBO data from peacetime to wartime costs. Although the multiplier is derived from data for a particular time (2003–2014) and place (Iraq, Afghanistan), it provides a benchmark for how combat has historically increased operating costs. I suspect this multiplier is low, based on my more granular research. To name just one example, the inflation-adjusted increase in operating costs for three helicopters — CH-47D, UH-60L, and AH-64D — from 1998 (peacetime) to 2007 (wartime) was 140%, 262%, and 541%, respectively.
Weapons
Estimated cost: $20.77 billion
The weapons itemized below are grouped into offensive and defensive munitions. I make this distinction because each group requires its own methodology.5
Offensive
The last time the Pentagon provided a figure on the number of munitions it dropped or fired during the war was on March 3, when CENTCOM Commander Bradley Cooper said the US had “struck nearly 2,000 targets with more than 2,000 munitions.” On March 4, Chairman of the Joint Chiefs of Staff Dan Caine told the press, “I know there have been a lot of questions about munitions…I want to tell you, teammates,6 as a matter of practice, I don’t want to be talking about quantities…we consider it an operational security matter.” You know the Trump administration really doesn’t want people talking about war costs when they deny transparency into the vaguest of metrics.
However, the Pentagon discloses the number of targets it has struck, albeit imprecisely — “over 6,000” as General Caine said in a March 13 briefing — which can be used to infer munition expenditures.
How do you estimate munition costs based on the number of targets alone?
First, guess what General Caine meant by “over 6,000” targets. My guess: 6,400.
Second, multiply the estimated targets by the average number of munitions US and/or NATO forces used per target during a recent war. Or three wars, if you’re a show-off with poor time management.
Operation Iraqi Freedom (first 30 days only), Iraq, 19 Mar 2003–18 Apr 2003
29,199 munitions released / 19,898 targets struck = 1.47 munitions/target*
*Adjusted to 1.01 munitions/target to account for non-precision-guided munitions, though this might be an over-correction.7
Operation Unified Protector (NATO), Libya, 31 Mar 2011–31 Oct 2011
8,112 munitions released / ~6,000 targets struck = 1.35 munitions/target
Operation Inherent Resolve, Iraq & Syria, 16 Oct 2014–20 Jan 2017
65,461 munitions released / 39,608 targets struck = 1.65 munitions/target
Average of these wars’ average munitions per target = 1.36 munition/target. 6,400 targets times 1.36 munitions per target = 8,704 munitions.8
Of these 8,704 munitions, I assumed a 35-65 split between the very expensive, long-range, “stand-off” munitions used en masse during the early days of the war and the less expensive, short-range “stand-in” munitions the US has used more frequently since. The estimated split is based on officials’ statements.
Stand-off munitions
Quantities were estimated based on media reports, open-source intelligence, historical data, and forensic analysis of arms and munitions use. Munitions (unit cost) include: Tomahawk ($2 million), ATACMS ($1.6 million), PrSM ($2.5 million), AGM-88 HARM/AARGM/AARGM-ER ($1.9 million for the AARGM-ER, which replaces the AARGM, which replaced the HARM) JASSM ($2.9 million), JSOW (shares JASSM’s $2.9 million unit cost, as JASSM replaces the JSOW. However, I halved the associated cost to account for JASSM having twice the payload of JSOW.)
This includes 725 Tomahawk missiles, matching the rate at which they were fired during the first two weeks of Operation Iraqi Freedom — approximately 400 were fired during the first four days of both the 2003 Iraq War and 2026 Iran War. Other estimated quantities: 75 ATACMS, 55 PrSM, 1,016 JASSM, 600 AGM-88, 575 JSOW.
Stand-in munitions
The estimated quantities9 of the following guided bombs are based on the distribution of guided bombs dropped during the first 30 days of the 2003 Iraq War (2,000lb bombs, 36%; 1,000lb, 17%; 500lb, 47%).
2,000lb GBU-31 (MK84/BLU-109 warhead + JDAM)
1,000lb GBU 32 (MK83/BLU-110 warhead + JDAM)
Quantity: 846
Unit cost: $78,923
500lb GBU 38 (MK82/BLU-111 warhead + JDAM)
Quantity: 2,248
Unit cost: $74,975
Estimated Hellfire expenditures were based on media reports and open-source intelligence.
Hellfire missile
These figures exclude the unspecified but reportedly large number of LUCAS one-way drones fired (~$35,000 each) as they were likely used predominately to saturate enemy defenses rather than destroy specific targets (Cooper likely excluded these drones from his munitions count on March 3). Also excluded are many of the “tens of thousands of pieces of ordnance” General Caine said were dropped on March 2.
*See more cost data here.
Defensive
Counter-missile
Number of missiles Iran fired: 1,224
Share of Iranian missiles that survived the boost phase: 93%
During the June 2025 war, 93% of Iranian missiles (546/588) survived the boost phase.
Share of surviving missiles considered threats and engaged by American, Israeli, or Gulf air defenses: 81%
The share was 62% during the June 2025 war, but with the reduced distance between Iran and US bases in the Gulf — which reduces the time for determining whether a missile is a threat — I assumed that half the missiles assessed as non-threats in 2025 are considered threats in 2026.
Missiles US and US-friendly forces attempted to shoot down: 922
Average number of interceptors (missiles used to shoot down incoming missiles) used to shoot down each Iranian missile: 1.7
Although 1.1 were used per Iranian missile in the June 2025 war (361 interceptors for 339 missiles), US forces averaged two interceptors for each Houthi missile in 2024–25, and used 30 Patriot interceptors to shoot down 13 Iranian missiles fired at al-Udeid air base that Iran warned were coming.
Interceptors fired at Iranian missiles: 1,567
Share of interceptors fired by US forces: 86%
The US fired 72% of the interceptors during the June 2025 war (Israel fired 101; the US fired 230 defending Israel and 30 defending al-Udeid). For the 2026 war, I estimated conservatively that the US would assume half of the non-US burden from 2025, given Iran’s focus on attacking US military bases, and the relative decline in air defense capacity of Gulf countries compared to Israel.
Interceptors fired by US forces: 1,348
I assumed a reverse mix of the interceptors the US fired during in June 2025 (with SM-3 split evenly with SM-6/SM-2s) because of the emphasis on US military bases as targets, where Patriot batteries are prevalent. This yielded an estimated 778 Patriot interceptors fired, which I later adjusted slightly to 800 to match the figure given by officials. (Will anyone be impressed by how close I got using my model? Probably not — most people have stopped reading at this point and the people who still are likely aren’t impressed by that sort of thing, presumably having made much more impressive estimates themselves recently. Thanks for reading, by the way.) I offset the resultant increase by subtracting 22 from the SM-3 total, due to the interceptors being in comparatively fewer stockpiled quantities.
Patriot
Quantity: 800
Unit cost: $4.6 million
THAAD
Quantity: 156
Unit cost: $15.5 million
SM-3
Quantity: 185
Unit cost: $28.7 million
SM-6/SM-2
Quantity: 207
Unit cost: $5.3 million (SM-6 unit cost, as it replaces the SM-2)
Counter-drone
Number of drones Iran fired: 2,700
Share of drones determined to be a threat and engaged by air defenses: 87%
It was 73% during the June 2025 war, but I halved the number of non-threatening drones due to the significantly shorter distance from origin to target.
Percent of drones shot down by the US: 70%
The US shot down 18% during the June 2025 war, but I quadrupled the rate for 2026 due to the targeting of US bases.
Drones shot down by US forces: 1,648
Interceptors required to shoot down each drone: 2
This might be generous, considering it took US fighter aircraft two Sidewinder missiles to shoot down a balloon over Lake Huron in 2023.
US munitions used on Iranian drones: 3,297
The approximated mix of the 3,297 munitions is based on the mix (also approximated) that US forces used to shoot down Houthi drones. For example, 40% of Houthi drones shot down during Operation Rough Rider were felled using APKWS, so I assumed the same figure here.
AMRAAM
Quantity: 330
Unit cost: $1.4 million
AIM-9X Sidewinder
Quantity: 989
Unit cost: $485,000
APKWS
Quantity: 1,319
Unit cost: $39,494
Coyote
Quantity: 330
Unit cost: $126,538
Other
Total cost (est): $1.6 million*
*This includes a range of other munitions reportedly used to down Iranian drones, like 30mm rounds fired from Apache helicopters and 20mm fired from C-RAMs. This is a very rough estimate.
Losses
Estimated cost: $2.71 billion
Most of it is due to damaged infrastructure (largely radars) on US bases in the Gulf. The damage initially reported is usually revealed to be much worse once satellite imagery is examined. Unfortunately, satellite imagery can be on tape delay or worse, per ABC: “Since the conflict began, Planet Labs imposed a 14-day delay in releasing images from the region, while Vantor does not share imagery of U.S. military locations.” This is servile, cowardly, and ultimately undemocratic behavior. These companies should reassess their policies, including those that allowed invertebrates to assume leadership positions.
A notable loss of equipment was the three F-15 fighter aircraft shot down over Kuwait on March 1. How much each one costs depends on the media outlet. Good Morning America, for example, says they’re $31 million each. The Pentagon paid $103 million each in 2025.
Additional losses itemized here.
Subsidies
Estimated cost: $1.01 billion
The US-Israeli war with Iran is for the sole strategic benefit of Israel. It is against the strategic interests of the United States. What’s more, the US is covering a significant chunk of Israel’s war costs. That is apparent in pending arms sales that include tens of thousands of bombs, many of which come directly from US stocks (rather than waiting months or years for a contractor to produce them). These are classified as sales, but they aren’t sales in the conventional sense. US military aid functions like a gift card, where Israel is the purchaser but not the funder. Americans pay for these arms deals.
The $1.01 billion estimate reflects the value of bombs and interceptors Israel has expended that can be covered by military aid.
Bombs
Israel reportedly dropped 11,000 bombs during the first two weeks of the war. To estimate the cost, I multiplied the reported quantity by an even mix of the following precision-guided bombs (unit costs reflect 2026 procurement data and include the cost of the warhead and guidance kit, if applicable): 2,000lb GBU-31, $107,266; 1,000lb GBU-32, $78,923; 500lb GBU-38, $74,975; 250lb Small Diameter Bomb, $67,000.
Interceptors
Israel has fired an estimated 820 interceptors from its David’s Sling, Iron Dome, and Arrow 3 platforms through roughly the first two weeks of the war. In 2025, the US provided $40 million, $110 million, and $50 million in missile aid, respectively, for these systems, enough to fund 40 interceptors for David’s Sling, 2,750 for the Iron Dome, and 17 for the Arrow 3. Expect Trump to include billions of dollars for Israeli interceptors in any war funding request.
I may revisit this methodology. For bombs, why didn’t I just put the value of the pending arms deals? For interceptors, why did I only include the $200 million in US missile aid earmarked for procurement and not the other $300 million for R&D, when the latter frees up Israeli funding for missile procurement?
There’s always time for methodological adjustments during endless war.
SPECIAL THANKS TO: Abe B., Alan F., Alexander L., Alissa Q., Amin, Andrew R., AT., B. Kelly, Barbara B., Bart B., BeepBoop, Ben, Ben C.,* Bill S., Bob N., Brett S., Byron D., Carol V., Catherine L., Chris, Chris G., Claudia, Cole H., Coleman J., D. Kepler, Daniel M., Dave, David J., David S.,* David V.,* David M., Dharna N., Elizabeth R., Emily H.,* Errol S., Foundart, Fran Q., Francis M., Frank R., Fred R., Gary W., Gladwyn S., Graham P., Griffin R., Hunter S., IBL, Irene B., Isaac, Isaac L., Jacob, James G., James H., James N., Jamie LR., Jcowens, Jeff, Jennifer, Jennifer J., Jessica S., Jerry S., Joe R., John, John, John A., John K., John M., Jonathan S., Joseph B., Joshua R., Julia G., Julian L., Katrina H., Keith B., Kesh L., Kheng L., Lea S., Leah A., Leila CL., Lenore B., Linda B., Linda H., Lindsay, Lindsay S.,* Lora L., Mapraputa, Marie R., Mark L., Mark G., Marvin B., Mary Z., Marty, Matthew H.,* Megan., Melanie B., Michael S., Mitchell P., Nick B., Noah K., Norbert H., Omar A., Omar D.,* Peter M., Phil, Philip L., Ron C., Rosemary K., Sari G., Scarlet, Scott H., Silversurfer, Soh, Springseep, Stan C., TBE, Teddie G., Theresa A., Themadking, Tim C., Timbuk T., Tony L., Tony T., Tyler M., Victor S., Wayne H., William H.,* William P.
* = founding member
-Stephen (Follow me on Instagram, Twitter, and Bluesky)
Don’t feel bad for CSIS: it’s funded by weapons companies, and think tanks that prioritize cash over empathy (and intellectual honesty) don’t deserve yours.
The Pentagon still buys parts and upgrades for the SM-2s it’s got already, but the last year it bought SM-2s as fully-assembled missiles was 2011. Even if you assume upgrades to certain SM-2s have doubled the stockpile’s value — and thus its unit cost — the amount the Pentagon’s books say it spent firing those interceptors is still less than half (~40%) of what US taxpayers will realistically pay for them. Would the Pentagon request fewer SM-6s to replace the number of expended SM-2s for the same cost, given the SM-6’s more advanced capabilities? No. The main driver of the insane interceptor cost during the Iran War isn’t a lack of accuracy or technology, it’s saturation — the sheer volume of Iranian missiles the US is trying to intercept. To have a chance at shooting down 150 incoming missiles, you need at least 150 interceptors. Choosing to have 60 fancy interceptors over 150 serviceable ones would be, to be blunt, moronic. So why doesn’t the Pentagon just buy the less fancy but still capable interceptors that are at most ~40% of the price per unit of the new version? Many reasons, but the military-industrial complex’s culture of endless money is definitely one of them.
Later in this article you’ll see that I fold personnel costs into Operation and Support (O&S) costs. Given that I just mentioned reservist activation, I should explain how I avoided double counting. I adjusted the CBO force structure tool using only active-duty units, with all reserve components set to zero. That means the baseline O&S estimate assumes a war fought solely with the active forces already included in the model. I then used a wartime multiplier that’s normalized per troop, so it does not implicitly capture the surge in personnel or reserve mobilizations that occurred during those wars. For that reason, adding the reservist mobilization funding from the Sec. 1421 anomaly as a separate lump-sum startup cost does not duplicate anything in the O&S estimate. The 17,193 reservists activated under that provision represent an expansion of the force that is not present in the CBO model, since reserve components were excluded from the force structure inputs.
Excerpt [translated]: “During May 2025, the State of Israel began Operation ‘Gideon’s Chariots,’ in which the scope of reserve mobilization increased beyond expectations and resulted in additional combat expenses. On June 13, 2025, the State of Israel launched Operation ‘[Rising Lion]’ against Iran, which included significant attacks by the defense establishment using a variety of means in Iran. These attacks also resulted in Iranian counterattacks on Israel and significant defense efforts by the security forces. In light of the above, the government was required and is still required to spend significant amounts, both for the purposes of the fighting and as a response to the victims of hostilities, in light of the increase in their scope due to the continued intensity of the fighting, which was not reflected in the forecasts when the Budget Law for 2025 was formulated and approved.”
Ordinarily I find the distinction not that instructive, as the availability of one informs the use of the other. In this context and in others, defensive munitions help shield belligerents from retaliation, thereby making the decision to use offensive munitions easier. Unrelatedly, in the original version of this newsletter I mistakenly wrote $20.78 in this section instead of $20.77 (billion), which is the correct figure and the one that appears in the table above. My fingers occasionally have the dexterity of sausages.
Hear that? We’re teammates. Not a teammate I’d want, considering General Caine’s expressed desire for a lack of transparency, accountability, and tolerance for criticism. Relatedly: this isn’t a fucking game, Dan. You’re orchestrating mass murder at the direction of a pedophile, who started this illegal war for the sole strategic benefit of a genocidal apartheid state. Enjoy being Trump’s fall guy.
I adjusted the 1.47 munitions/target ratio for OIF to 1.06. Explanation: In the latter two wars, US/coalition/NATO forces used all precision-guided missiles and bombs. However, 32% of the munitions dropped or launched at Iraq during the first 30 days of the 2003 war were unguided. To approximate how many fewer munitions would have been released during that 30-day stretch had coalition forces only been using precision-guided munitions, I multiplied the number of unguided munitions used (9,251) by 0.13, which approximates how many precision guided munitions would’ve been required to achieve the same effect as the unguided bombs. The 0.13 figure comes from a study that found it took 11.3 precision guided munitions on average to destroy a bridge, while 85 unguided munitions on average were required to do the same. However, this likely overstates the boost in efficiency from precision guided munitions, because not all bombs are dropped to destroy bridges; many are dropped, for example, for area effect, where precision isn’t nearly as relevant. Still, I adopted the new figure of 1.06 munitions per target.
I mistakenly wrote 4,624 in the original article. That reflects the quantity used in the first week of the war. The error was purely typographical and didn’t reflect the figure produced from my two week calculation. Correcting this figure didn’t change any other figures in the article. I regret the error.
I mistakenly left in the quantities for this subset of munitions from the first week’s cost estimate. These errors were purely typographical and don’t reflect the values produced by the two week calculations. Correcting these figures didn’t change any other figures in the article. I regret the error.