
Americans still haven’t recovered from the pandemic
Polygraph | Newsletter n°314 | 3 Sep 2025

IN THIS NEWSLETTER: Why crisis-level economic anxiety isn’t just bad “vibes.”
*Al Jazeera is out with a new documentary called the Business of War. I haven’t watched it yet because I’m in it, but it’s apparently very good. First episode, here.
*Thank you, James G., for becoming Polygraph’s latest paid subscriber! If you appreciate Polygraph, please consider joining James and the other VIPs thanked at the bottom of each note.
Economic anxiety
Since 2001, Gallup has asked US voters whether they think their financial situation is getting better, staying the same, or getting worse. This year, a record number of Americans answered “getting worse.”
The 53% who said their financial situation is deteriorating surpasses the 49% who said so during the 2008 financial crisis. Responses have come within five percentage points of that mark just five times, and every one of them was in this decade.1 Crisis-level economic anxiety is the new normal.
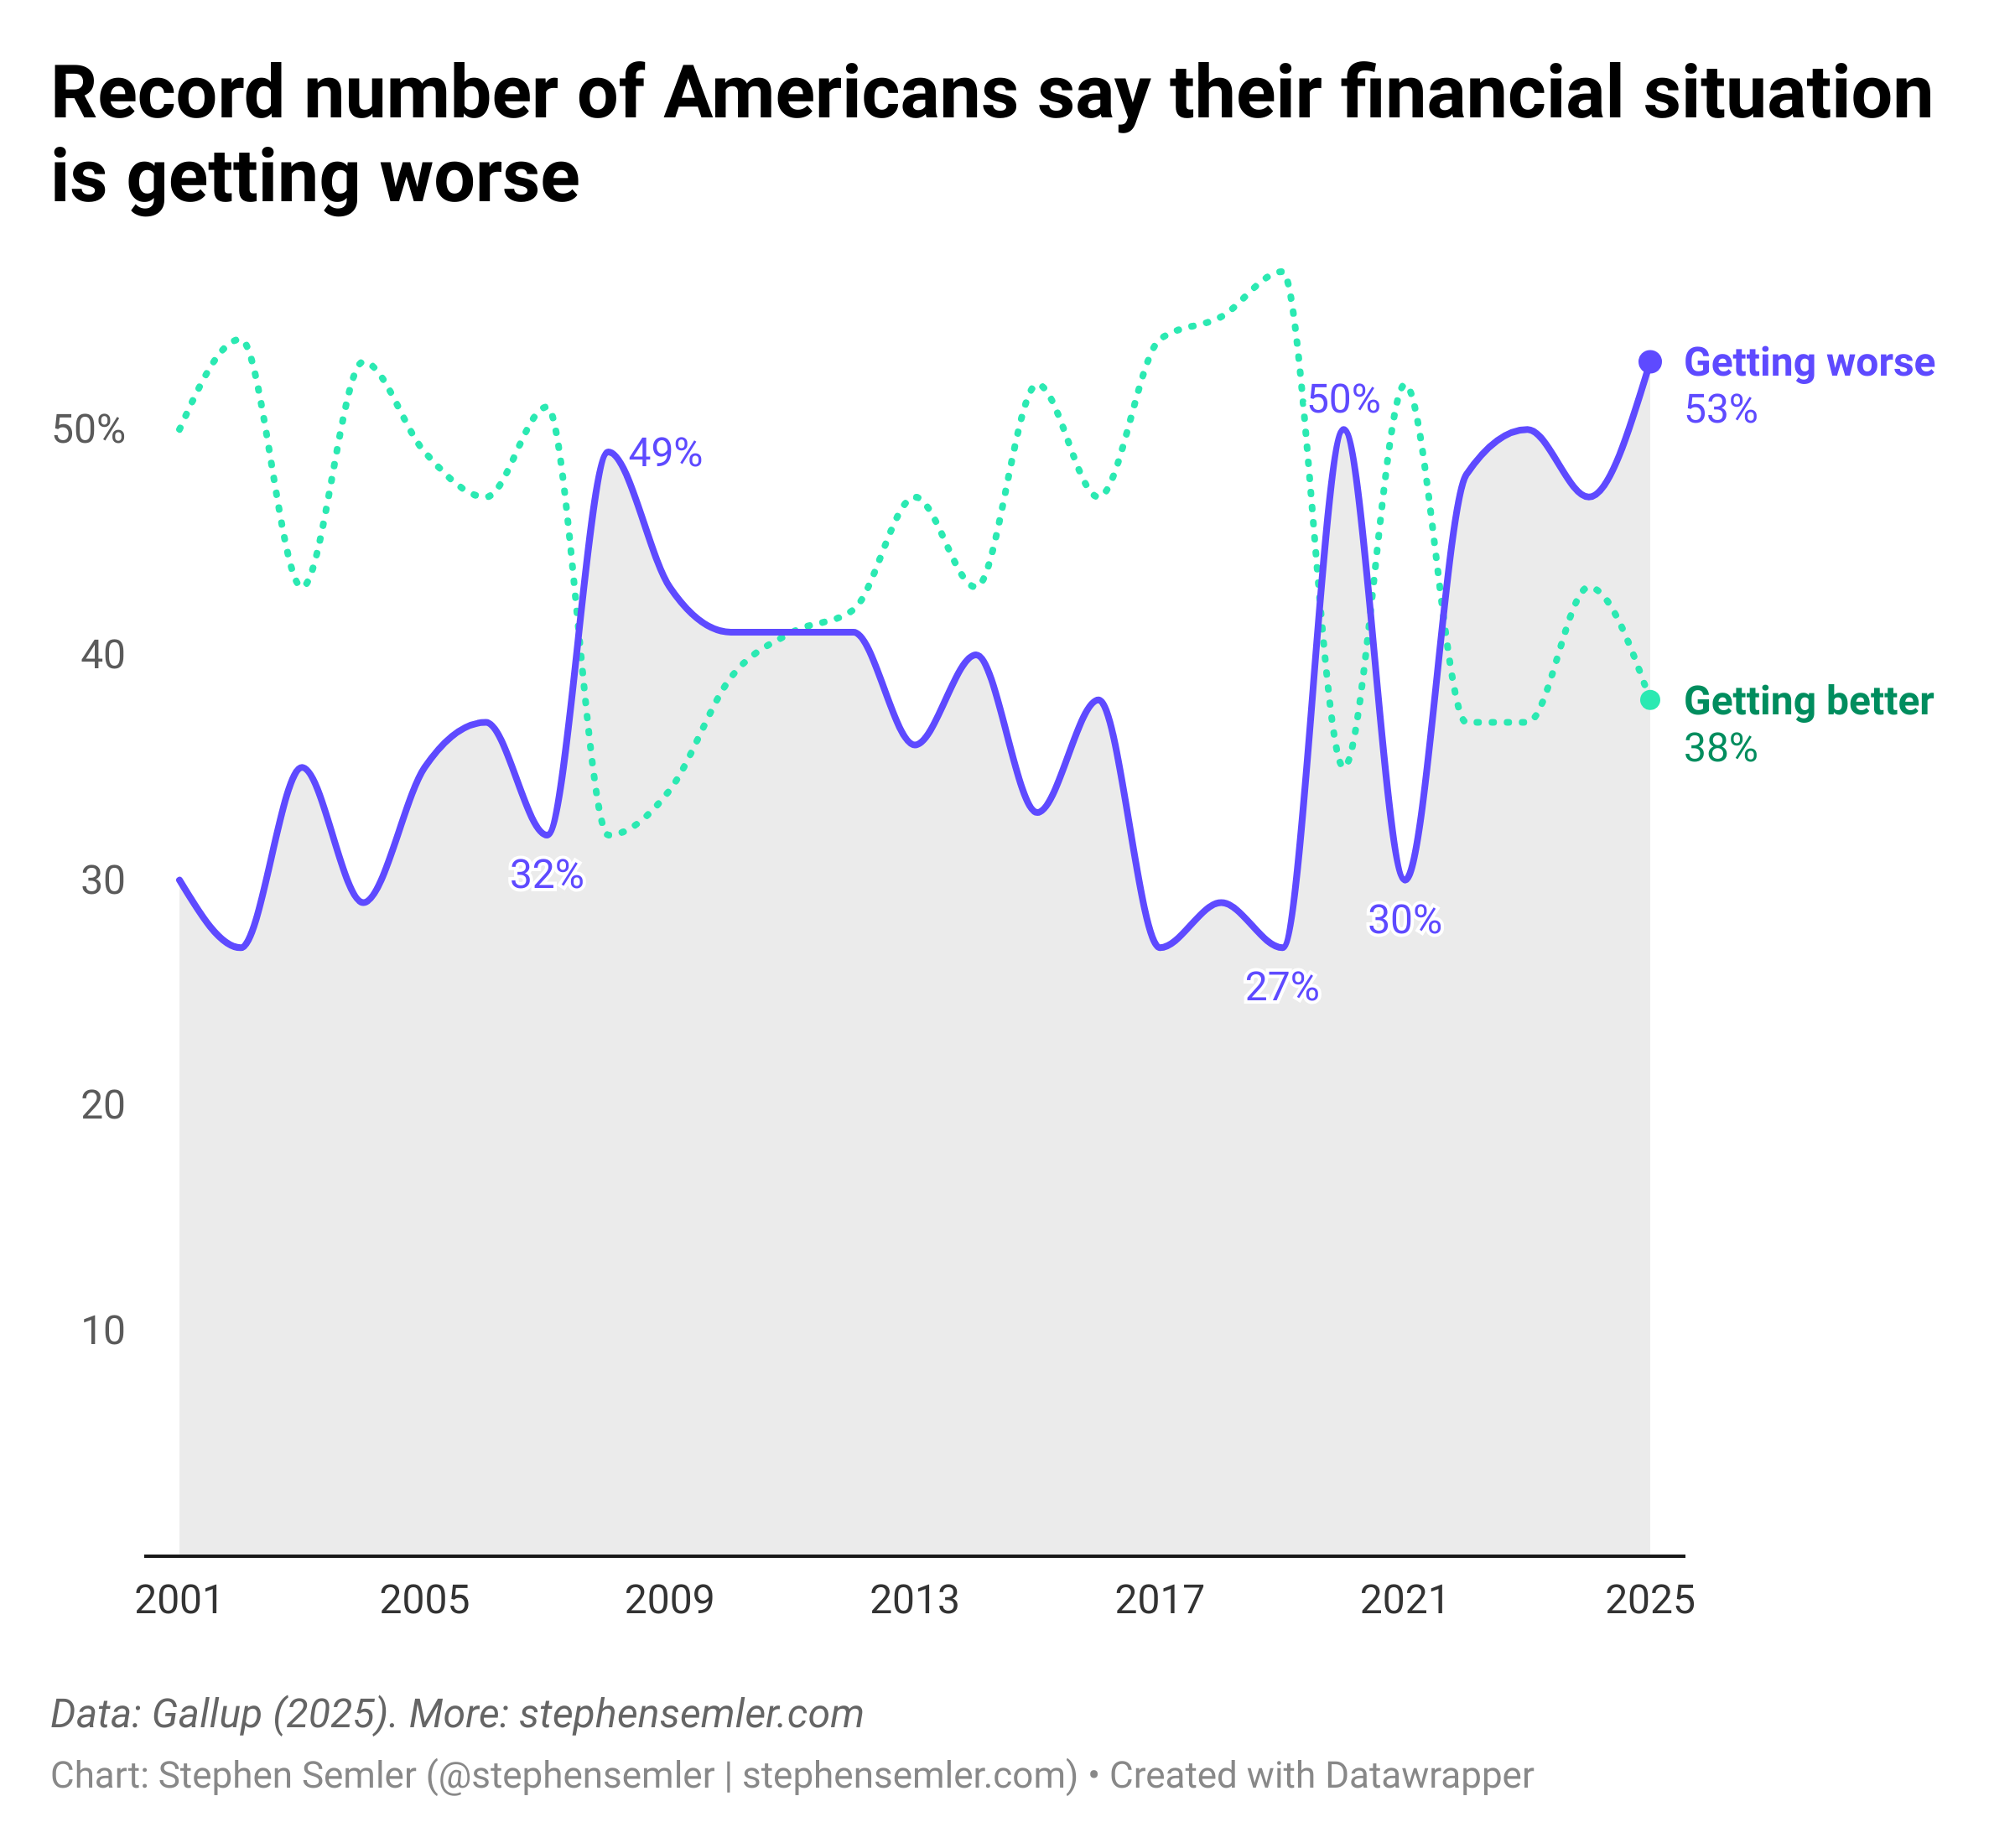
^Alt text for screen readers: Record number of Americans say their financial situation is getting worse. This graph shows the percent of Americans who say their financial situation is getting worse (purple line) versus getting better (green line) since 2001. In 2025, 53% said it’s getting worse and 38% said it’s getting better. Data: Gallup.
The knock on surveys about economic anxiety is that respondents’ answers are often shaped at least partly by their degree of optimism or pessimism about the future, and those sentiments are strongly influenced by partisanship. Members of one political party generally feel better about things when their party is in charge, and vice versa. For example, 25% of Republican voters in 2024 said their financial situation was getting better, but in 2025, 61% did (+36). At the same time, the share of Democratic voters feeling good about their financial prospects fell from 66% before Trump was elected to 16% after (–50).
Out of politeness, let’s describe this partisan-obedient behavior as interesting, even though many of us actually think it’s moronic. So why take the data seriously at all? Because despite people’s interesting behavior, the data somehow still ends up making sense; as a whole, the anxiety is justified. The percentage of Americans who said their finances were getting worse shot up in 2008 (as it should, considering the financial crisis) and in 2020 (as it should, given the pandemic). The percentage falls when it’s supposed to, too: in 2021, the share reporting deteriorating financial conditions dropped by 20 percentage points. That happened because the US stumbled into building an almost European-level welfare state through the CARES Act (March 2020), Consolidated Appropriations Act (December 2020), and American Rescue Plan (March 2021). The result was a disjointed but formidable array of social programs overlapping in 2021, which led to a sharp decline in economic insecurity.
Economic insecurity
Economic insecurity isn’t the same as economic anxiety, but it’s close. Economic insecurity means being unable to reliably cover your basic necessities. Economic anxiety is distress from experiencing economic insecurity or feeling like you’re headed toward it. The former is an objective, material experience; the latter is a subjective, emotional response to that experience. It's being insecure versus feeling insecure.
I like economic insecurity (as a concept) for a few reasons. First, it accounts for the vast but often ignored material hardship that exists above the poverty line. Second, it’s relevant. Like inequality, insecurity is liable to harm everybody but the wealthy. Third, it’s relatable, possibly even more than inequality. In my experience, people interpret their economic situation primarily by gauging how their resources align with their needs, not how their resources compare with someone else’s. Polling is required to say for sure, but I suspect the public feels more insecure than unequal.
Last election, Republicans capitalized on the widespread sense (and reality) of economic insecurity. A smart play, considering it was voters’ number one issue. Nominally, “the economy” was the top concern, but most voters evaluated the economy in terms of the difficulty of living in it — that is, the spiraling cost of living mattered much more than the state of the stock market or GDP or even unemployment. Democrats largely refused to acknowledge that rosy economic conditions at the national level allowed for pervasive misery at the human level. Liberal pundits claimed that widespread economic anxiety was simply bad “vibes”2 — something that only existed in people’s heads, the result of either partisan brainwashing or low self-esteem. I remember seeing oily and misshapen Gen Z influencers tied to the administration parrot this take on social media, always in a condescending tone, and wondering whether Democrats were trying to lose.
Pathologizing economic anxiety turned out not to be a political winner for several reasons, the biggest one being that anxiety was a perfectly reasonable response to economic insecurity, which there was plenty of. There are two charts below. The first shows that economic anxiety hasn’t retreated to pre-pandemic levels. The second graph helps explain why that’s the case — there’s more subjective anxiety because there’s more objective insecurity. The reason so many people think they’re worse off compared to before the pandemic is because they are.
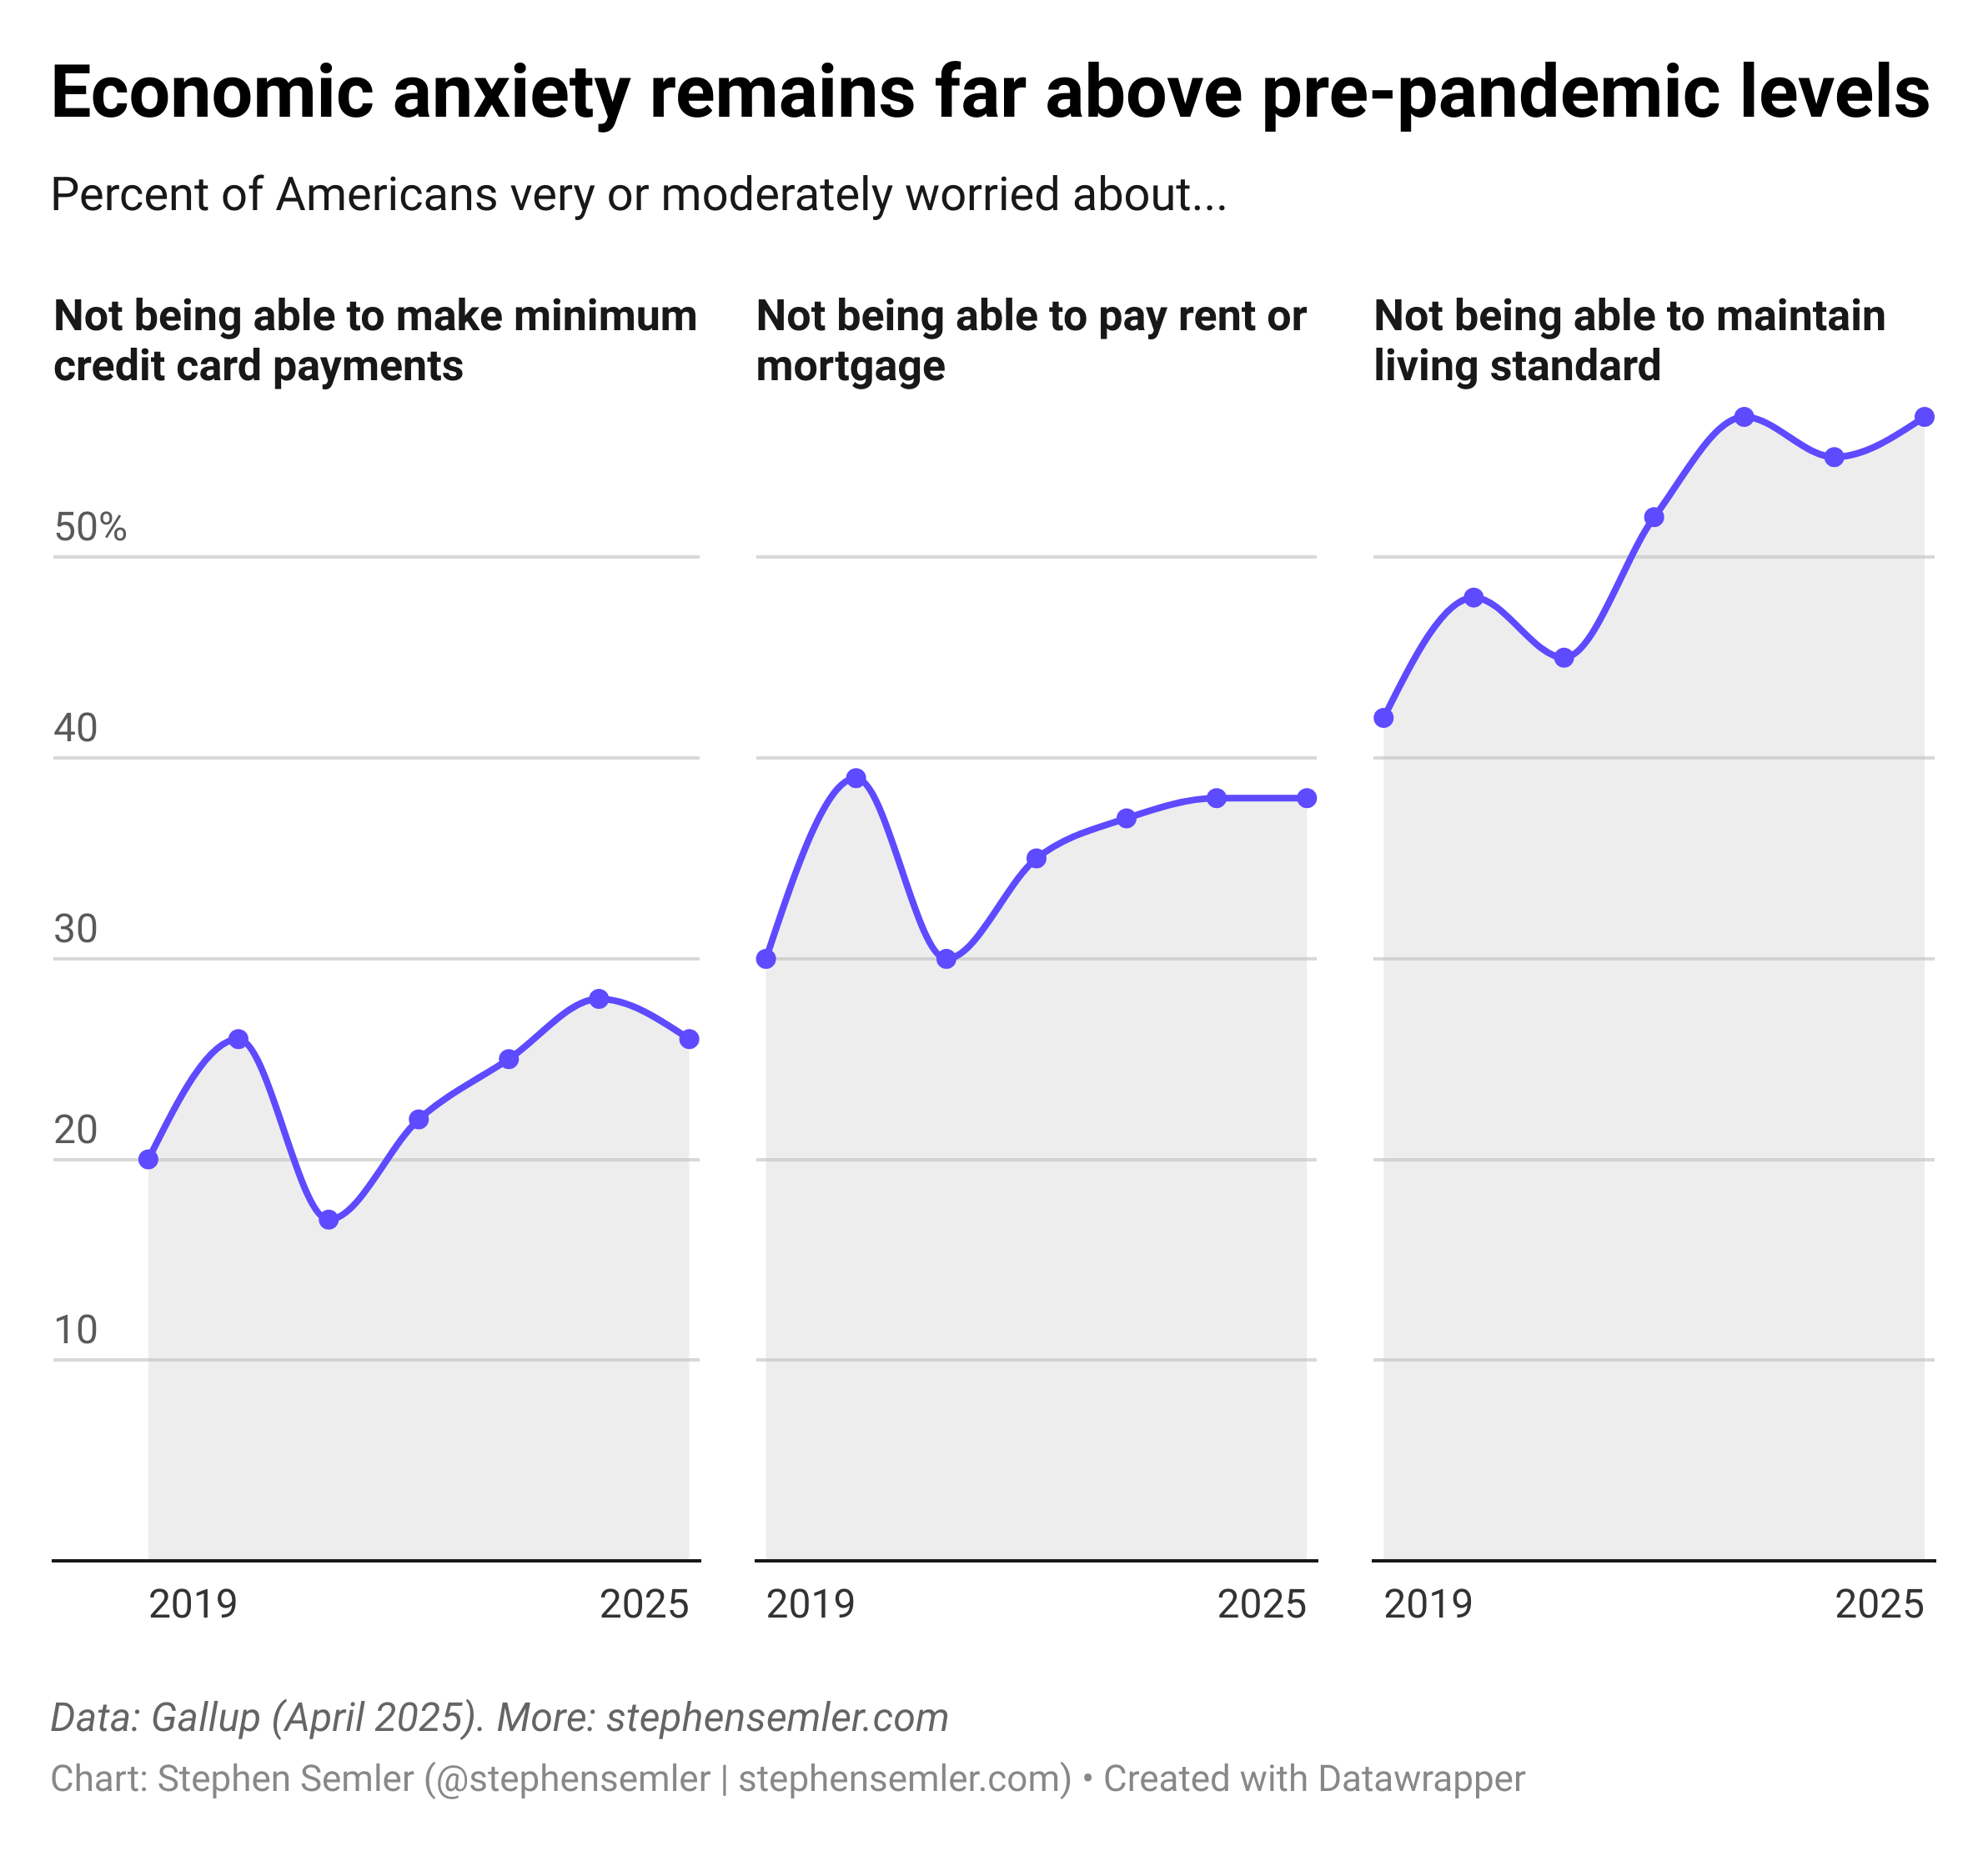
^Alt text for screen readers: Economic anxiety remains far above pre-pandemic levels. This graph shows the percent of Americans very or moderately worried about not being able to make minimum credit card payments, pay rent or mortgage, or maintain their standard of living from 2019 to 2025. All three show a dip in 2021 before climbing beyond 2019’s levels. Data: Gallup.
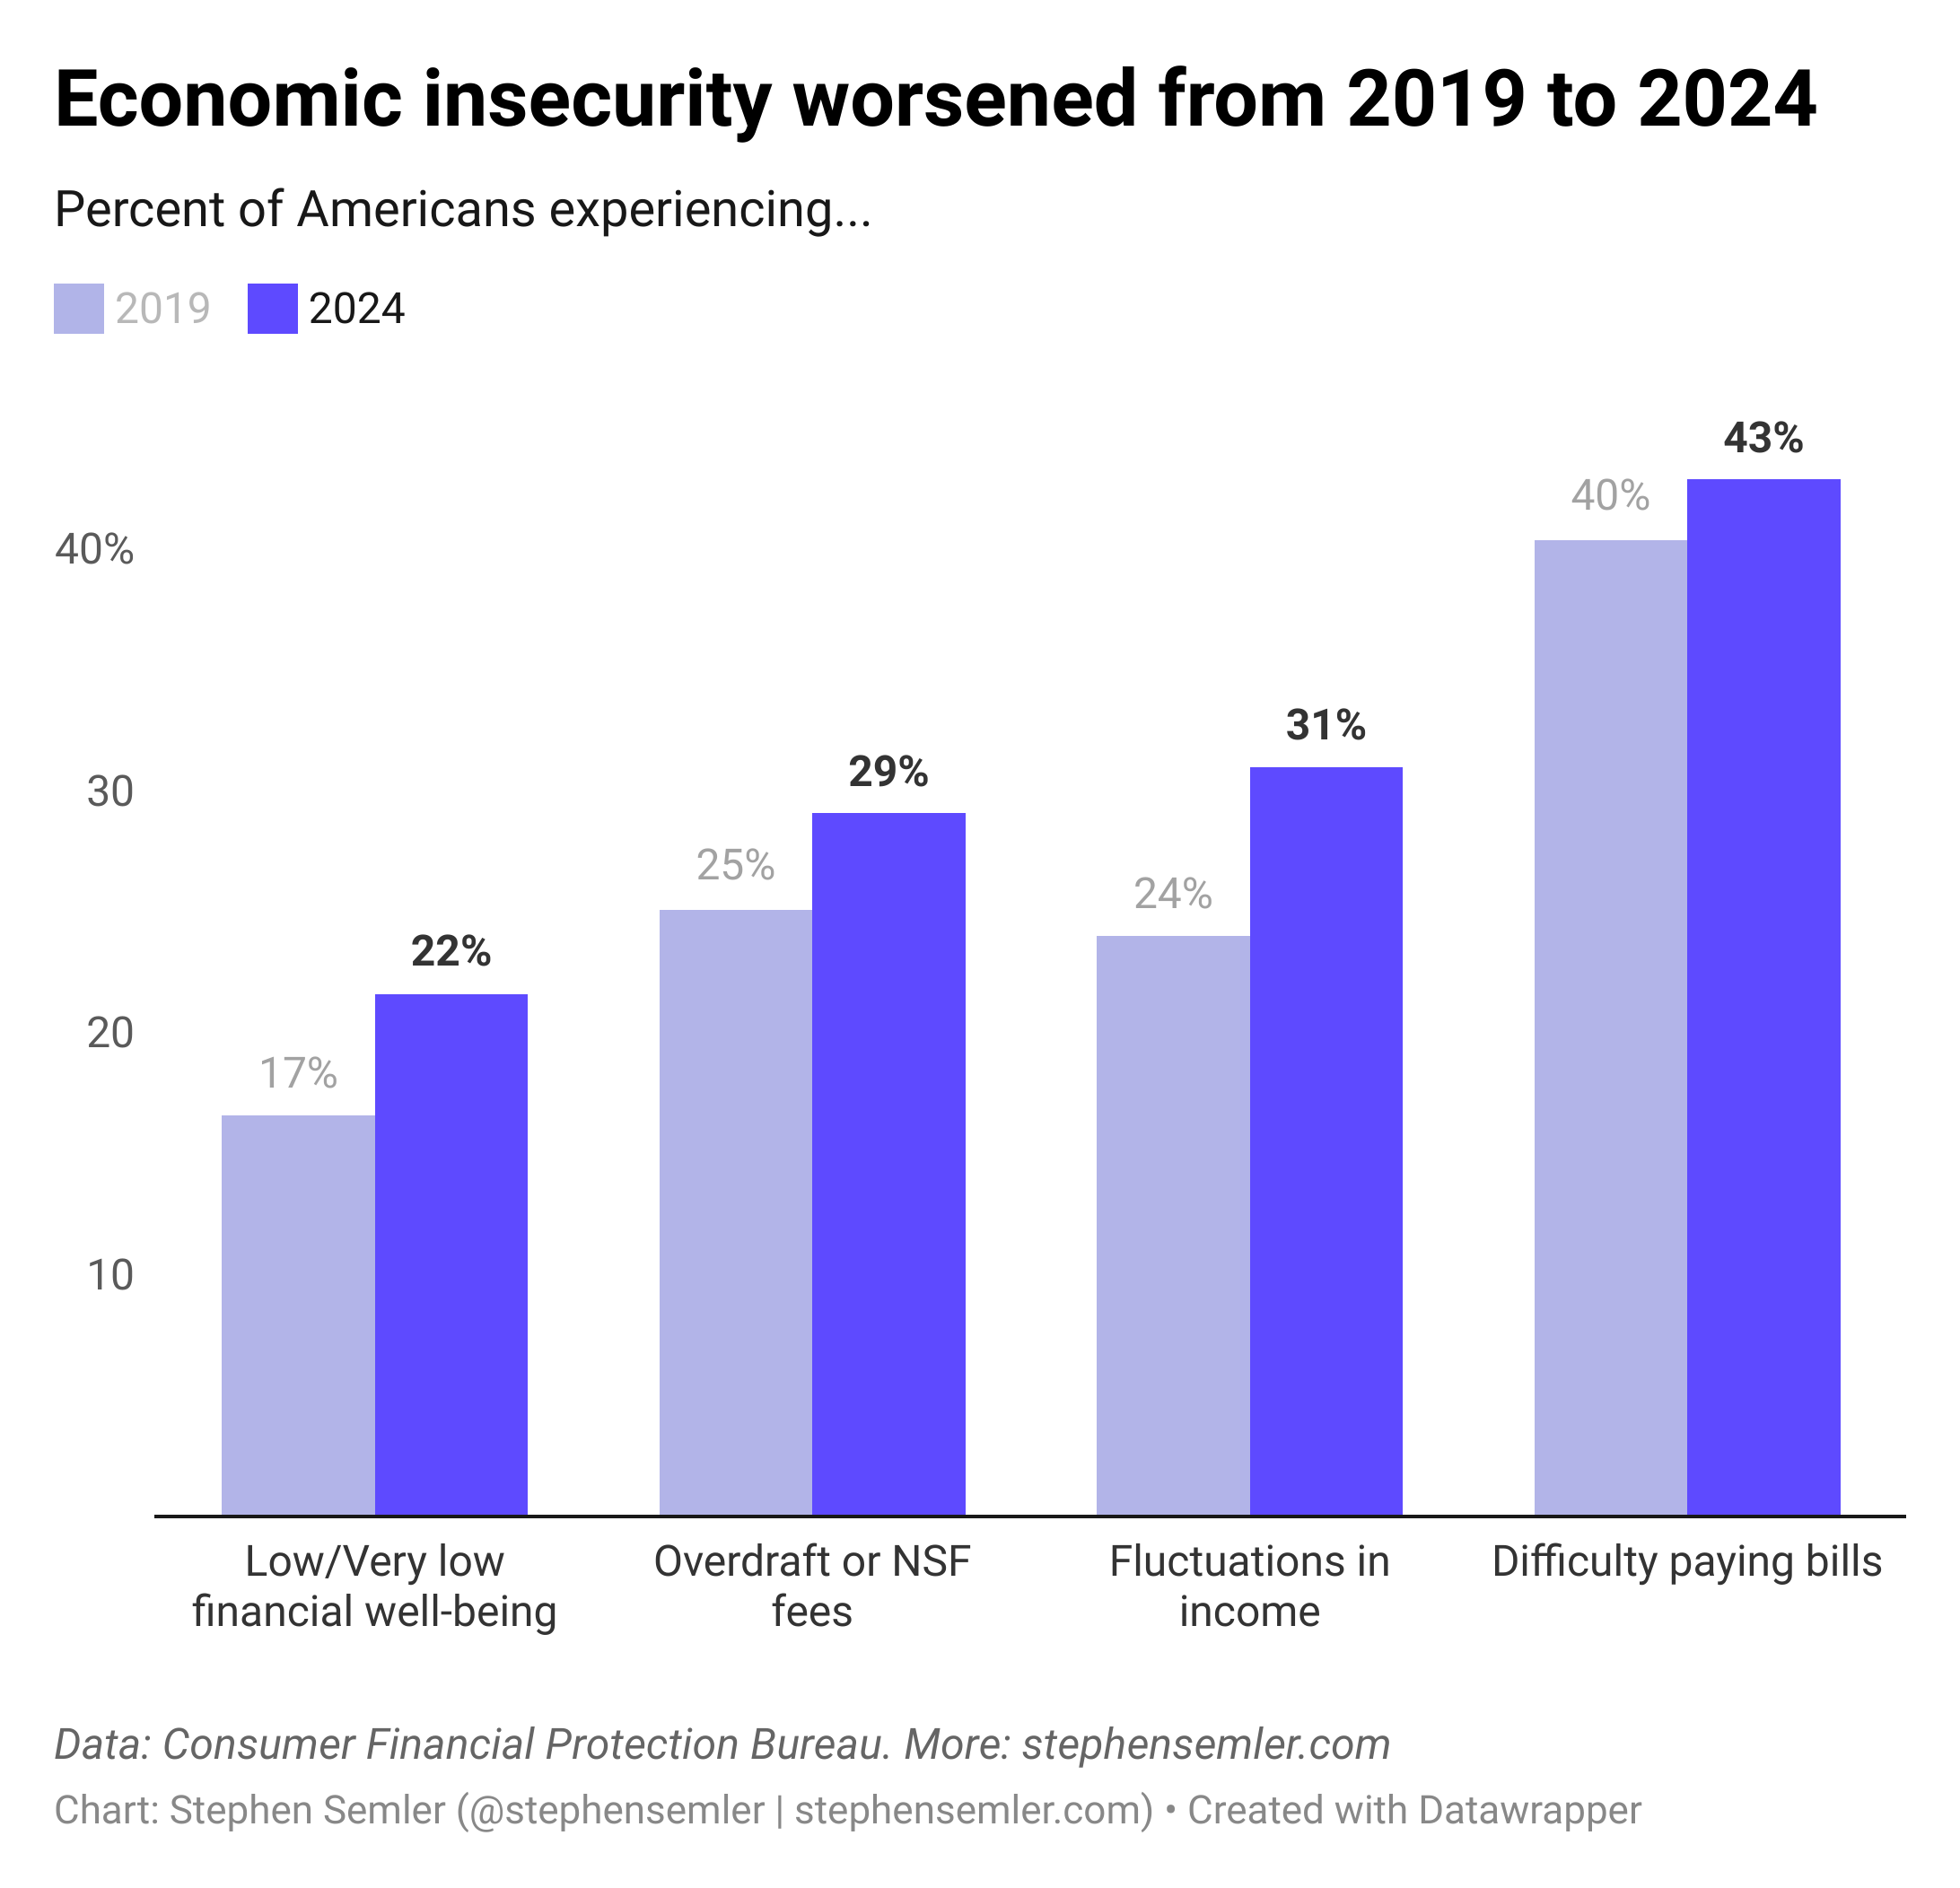
^Alt text for screen readers: Economic insecurity worsened from 2019 to 2024. This graph compares 2019 and 2024 across four barometers of financial difficulty. The numbers refer to the percent of the U.S. population experiencing each difficulty. Low/very low financial well-being: 17% in 2019, 22% in 2024. Overdraft or NSF fees: 25%, 29%. Fluctuations in income: 24%, 31%. Difficulty paying bills: 40%, 43%. Data: Consumer Financial Protection Bureau.
SPECIAL THANKS TO: Abe B., Alan F., Amin, Andrew R., AT., B. Kelly, BartB., BeepBoop, Ben, Ben C.,* Bill S., Bob N., Brett S., Byron D., Chris, Chris G., Cole H., D. Kepler, Daniel M., Dave, David J., David S.,* David V.,* David M., Elizabeth R., Errol S., Foundart, Francis M., Frank R., Gary W., Gladwyn S., Graham P., Griffin R., Hunter S., Irene B., Isaac, Isaac L., Jacob, James G., James H., James N., Jamie LR., Jcowens, Jeff, Jennifer, Jennifer J., Jessica S., Jerry S., Joe R., John, John, John A., John K., John M., Jonathan S., Joseph B., Joshua R., Julia G., Julian L., Katrina H., Kheng L., Lea S., Leah A., Leila CL., Lenore B., Linda B., Linda H., Lindsay, Lindsay S.,* Lora L., Mapraputa, Marie R., Mark L., Mark G., Marvin B., Mary Z., Marty, Matthew H.,* Megan., Melanie B., Michael S., Mitchell P., Nick B., Noah K., Norbert H., Omar A., Omar D.,* Peter M., Phil, Philip L., Ron C., Rosemary K., Sari G., Scarlet, Scott H., Silversurfer, Soh, Springseep, Stan C., TBE, Teddie G., Theresa A., Themadking, Tim C., Timbuk T., Tony L., Tony T., Tyler M., Victor S., Wayne H., William P.
* = founding member
-Stephen (Follow me on Instagram, Twitter, and Bluesky)
For nearly every year from 2001 to 2025, Gallup conducted this poll in April. However, in some years, Gallup conducted this poll more than once. For year-to-year consistency, the polling data in the chart reflects April values only, unless April data was unavailable. In those two cases, the month the polling was conducted that was closest to April was chosen. Those exceptions are 2003 (conducted in March) and 2001 (conducted in October).
There’s a lot wrong with Krugman’s article (hyperlinked to “vibes” in the text). Krugman’s argument ultimately hinges on one graph showing an increase in the share of voters who said they were better off than five years ago from October 2024 (pre-election) to November 2024 (post-election). The graph shows a significant jump, which he chalks up to “supporters of both parties feel better about the economy when their party is in power, but Republicans swing much more strongly than Democrats.” That is of course true, but Krugman counts on that explaining much more than it actually does. I suspect this is why he doesn’t start the y-axis at zero: it makes the month-to-month change seem much more significant than it actually was. I also suspect it’s why Krugman omitted key data from the original source, showing readers only two of the 13 months presented in the source material. In 7 of the other 11 months, more survey respondents said they were better off than they were five years ago compared to those who did in November 2024. In proper context, the 46% favorability rating Krugman presents as extraordinary looks very normal. But Krugman did not give it proper context.
If partisanship (and Republican partisanship in particular) explains financial hardship data as Krugman claims, there should have been a significant decrease in financial favorability ratings among Democrats after Trump’s win, and a massive increase among Republicans. But in fact, there was an increase in favorable ratings from Democrats (and Independents) from October 2024 to November 2024. There was of course a larger increase among Republicans, but in the 13-month dataset, October 2024 and September 2024 are the only two months with favorability scores lower than November 2024. In every other month, Republican voters rated their financial situation higher than after Trump’s victory over Harris — i.e., while Joe Biden, who GOP voters loathed, was president. For example, way back in November 2023, GOP voters’ index score (percent favorable minus the percent unfavorable, plus 100) was 84. In November 2024 — after Trump’s win — the score was 54. Even though the index score is a three-month moving average, the November 2024 score should have been way higher if partisanship warped perceptions of people’s financial situation as much as Krugman claims.
Krugman concludes that voters are unreliable narrators — they might say otherwise, but voters definitely aren’t worse off now than they were in 2019. Data on economic well-being and financial stability from the Consumer Financial Protection Bureau, Census Bureau, Department of Agriculture, and others show that Americans are worse off now than they were in 2019.